Debugging
FintechOS Studio offers several options for debugging automation scripts from the development and testing environments.
Debugging Server (v22.1.4 or later)
On development environments, a dedicated JavaScript debugging engine can load your server automation scripts and expose them client-side in a FintechOS Portal instance. This allows you to take advantage of your browser's developer tools to debug your server automation scripts just like you would with client scripts. For instance, you can:
- execute your code line-by-line
- pause the code execution with breakpoints
- monitor variable values or custom expressions with watch expressions
Debugging Server Prerequisites
- A user account with the Debugger Users security role (see Security Roles).
- The
sys-workflowengine-useclearscriptandsys-workflowengine-enable-debuggingSystem Parameters must be set to 1. These enable the Microsoft ClearScript (ES6) JavaScript engine (instead of the default Jint JavaScript interpreter) and start the debugging server respectively.
When switching the JavaScript scripting engine from Jint to ClearScript, the alternate ES6 language specifications may impact your server automation scripts (see ES6 Compatibility Impact).
Use the Debugging Server
- Log in to a FintechOS Portal instance with a developer user account (see Debugging Server Prerequisites).
- A debug button is displayed on the portal's dashboard. Click the Debug button.
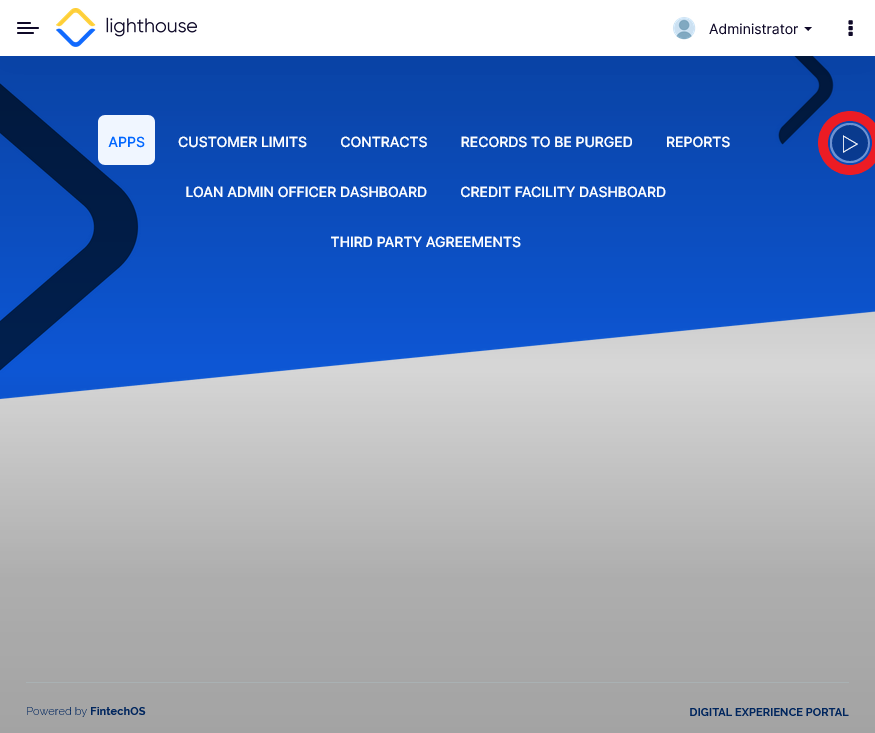
Alternatively, you can use the Ctrl+Alt+D or Command+Alt+D shortcut on Windows or MacOS operating systems respectively. - A list containing all server automation and all scripts executed in the status transition in a business workflow. Select the script(s) you wish to debug and click Start to initiate the debug session.
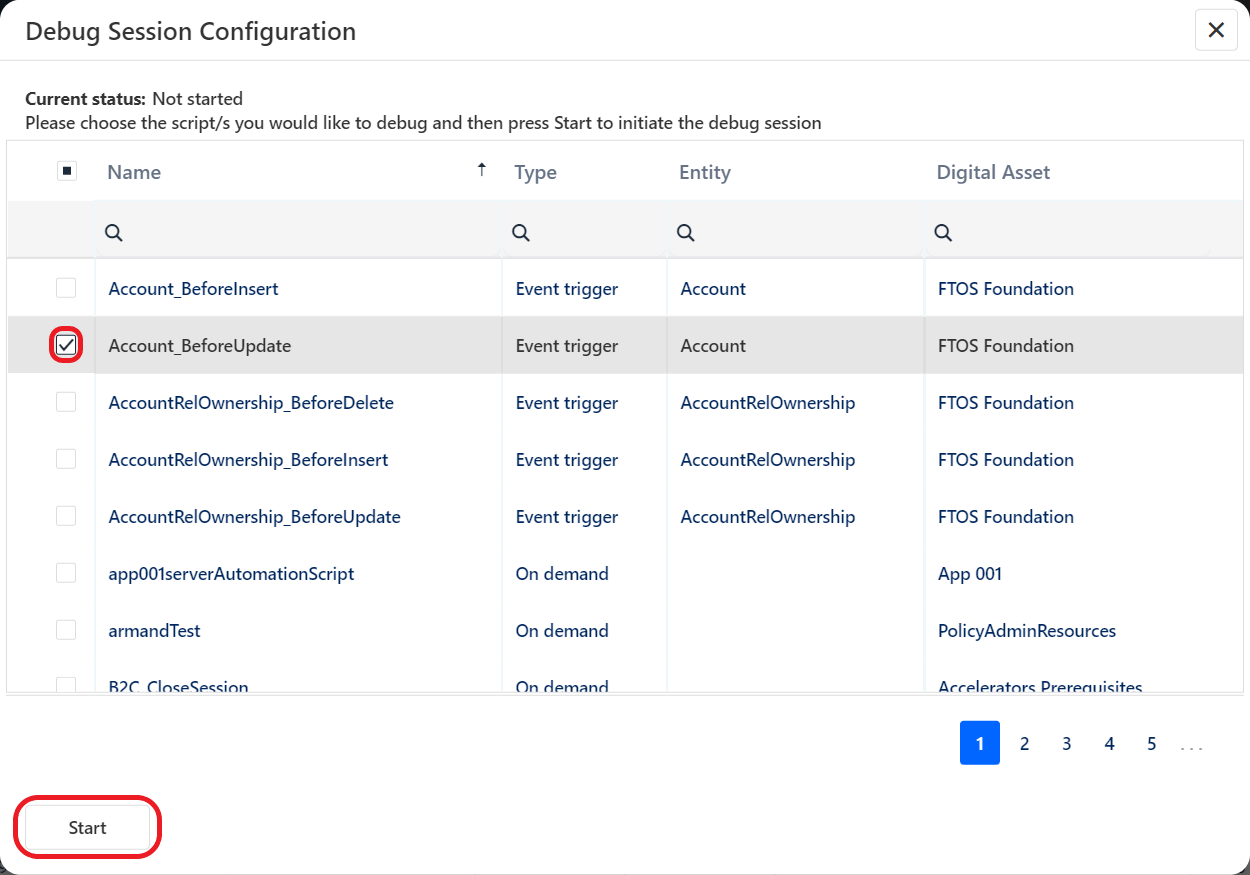
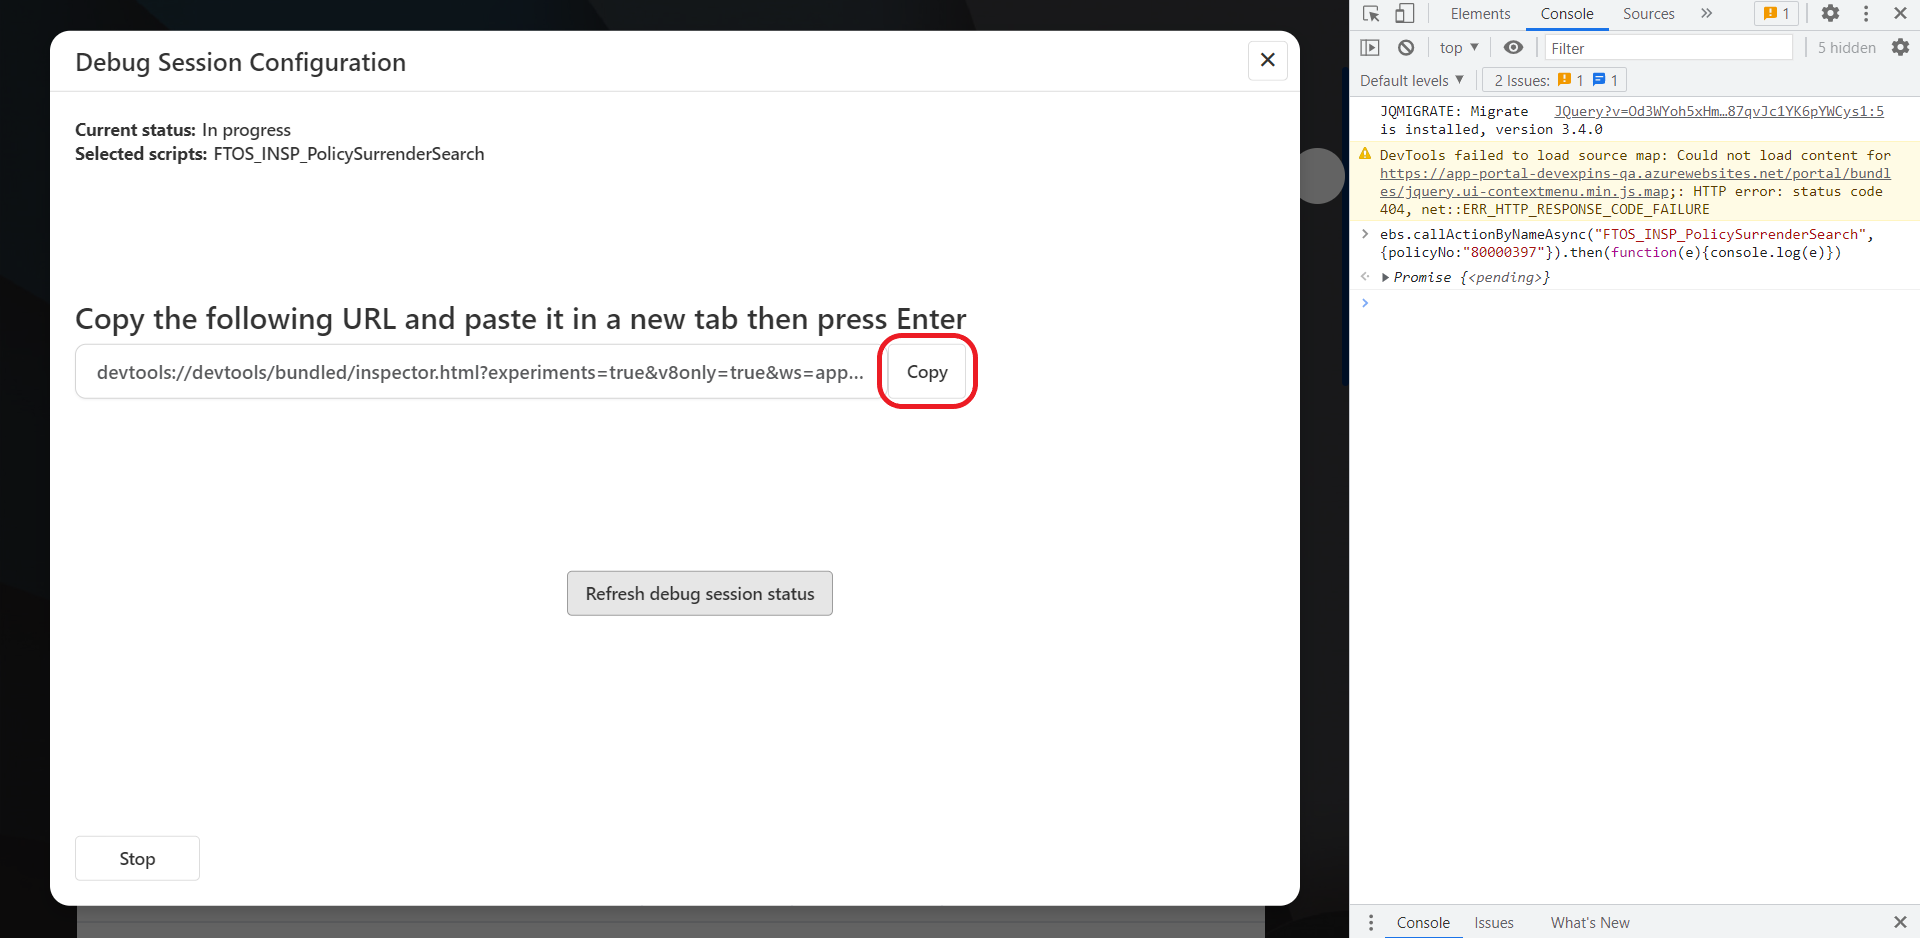
- The Debug Session Configuration engine is now waiting for you to trigger the script execution.
- Trigger the script:
- For Event Triggered Automation Scripts, trigger the corresponding CRUD event in the database.
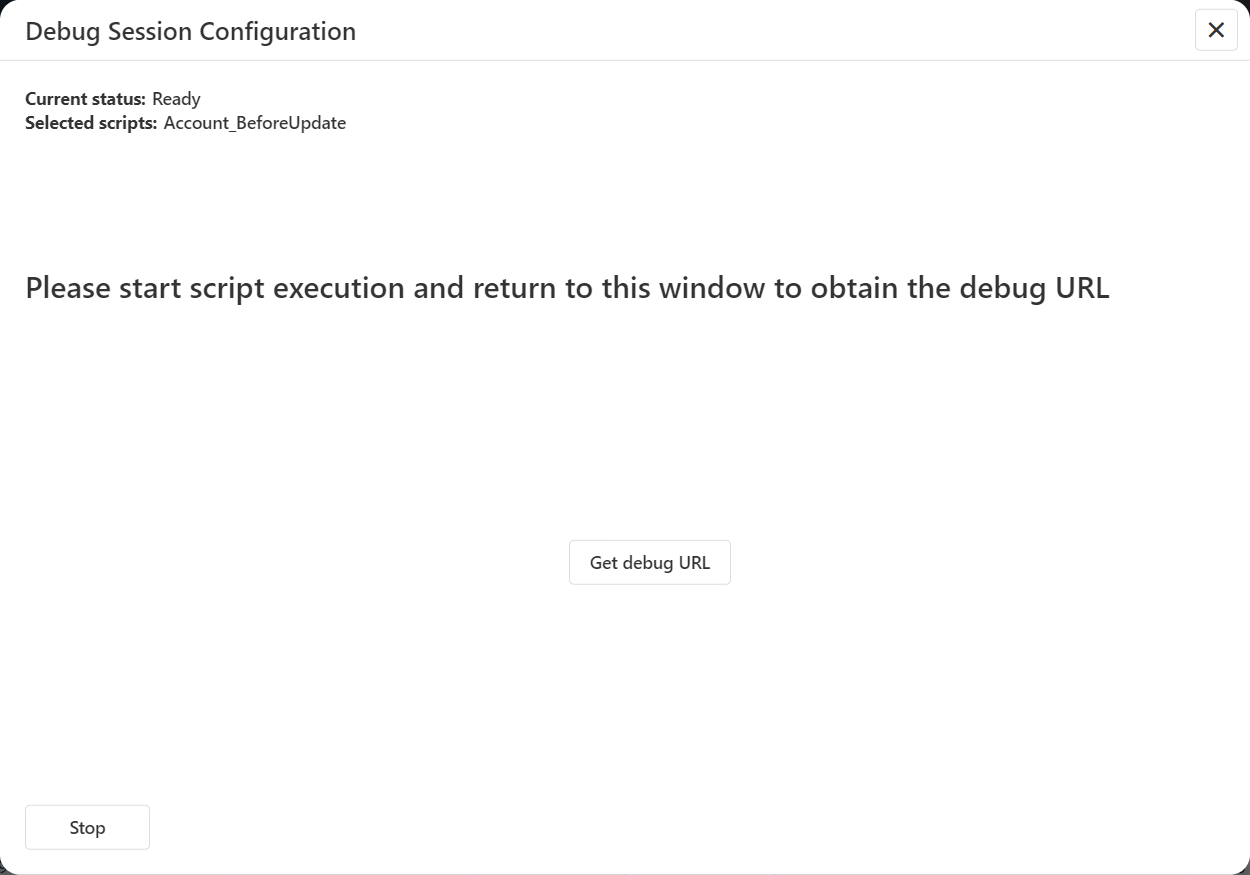
- For On-Demand Automation Scripts and status transition custom scripts, trigger them via an API call, or from a client process (for instance, from a form driven flow or directly through the browser console) via the ebs.callActionByNameAsync function.
- Click Get debug Url to retrieve the debug session URL.
- Copy the debug session URL and paste it in your browser's address bar (we recommend Google Chrome), then press Enter to open the link in your browser's DevTools window.
- The link initially opens a wrapper function for your script. Click the Resume Script Execution button in your browser's debugger.
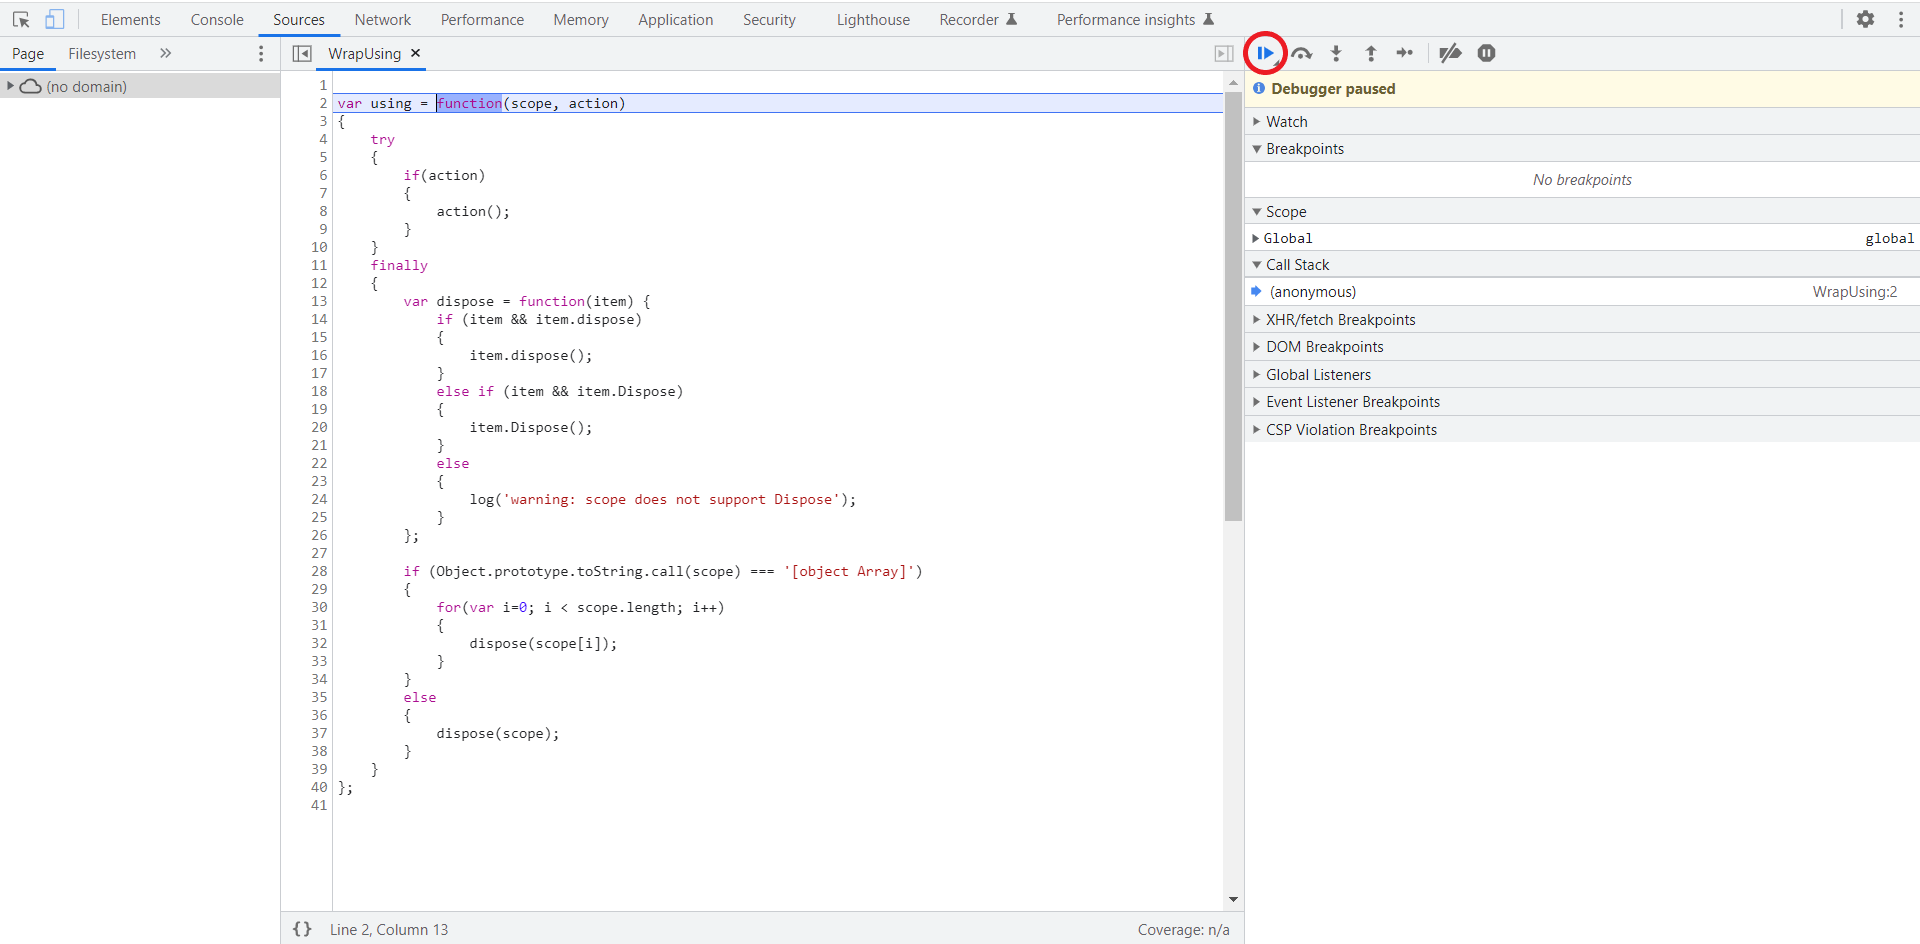
- Your script opens and its execution is paused at the start (a
debuggerinstruction is inserted automatically at the beginning of your script).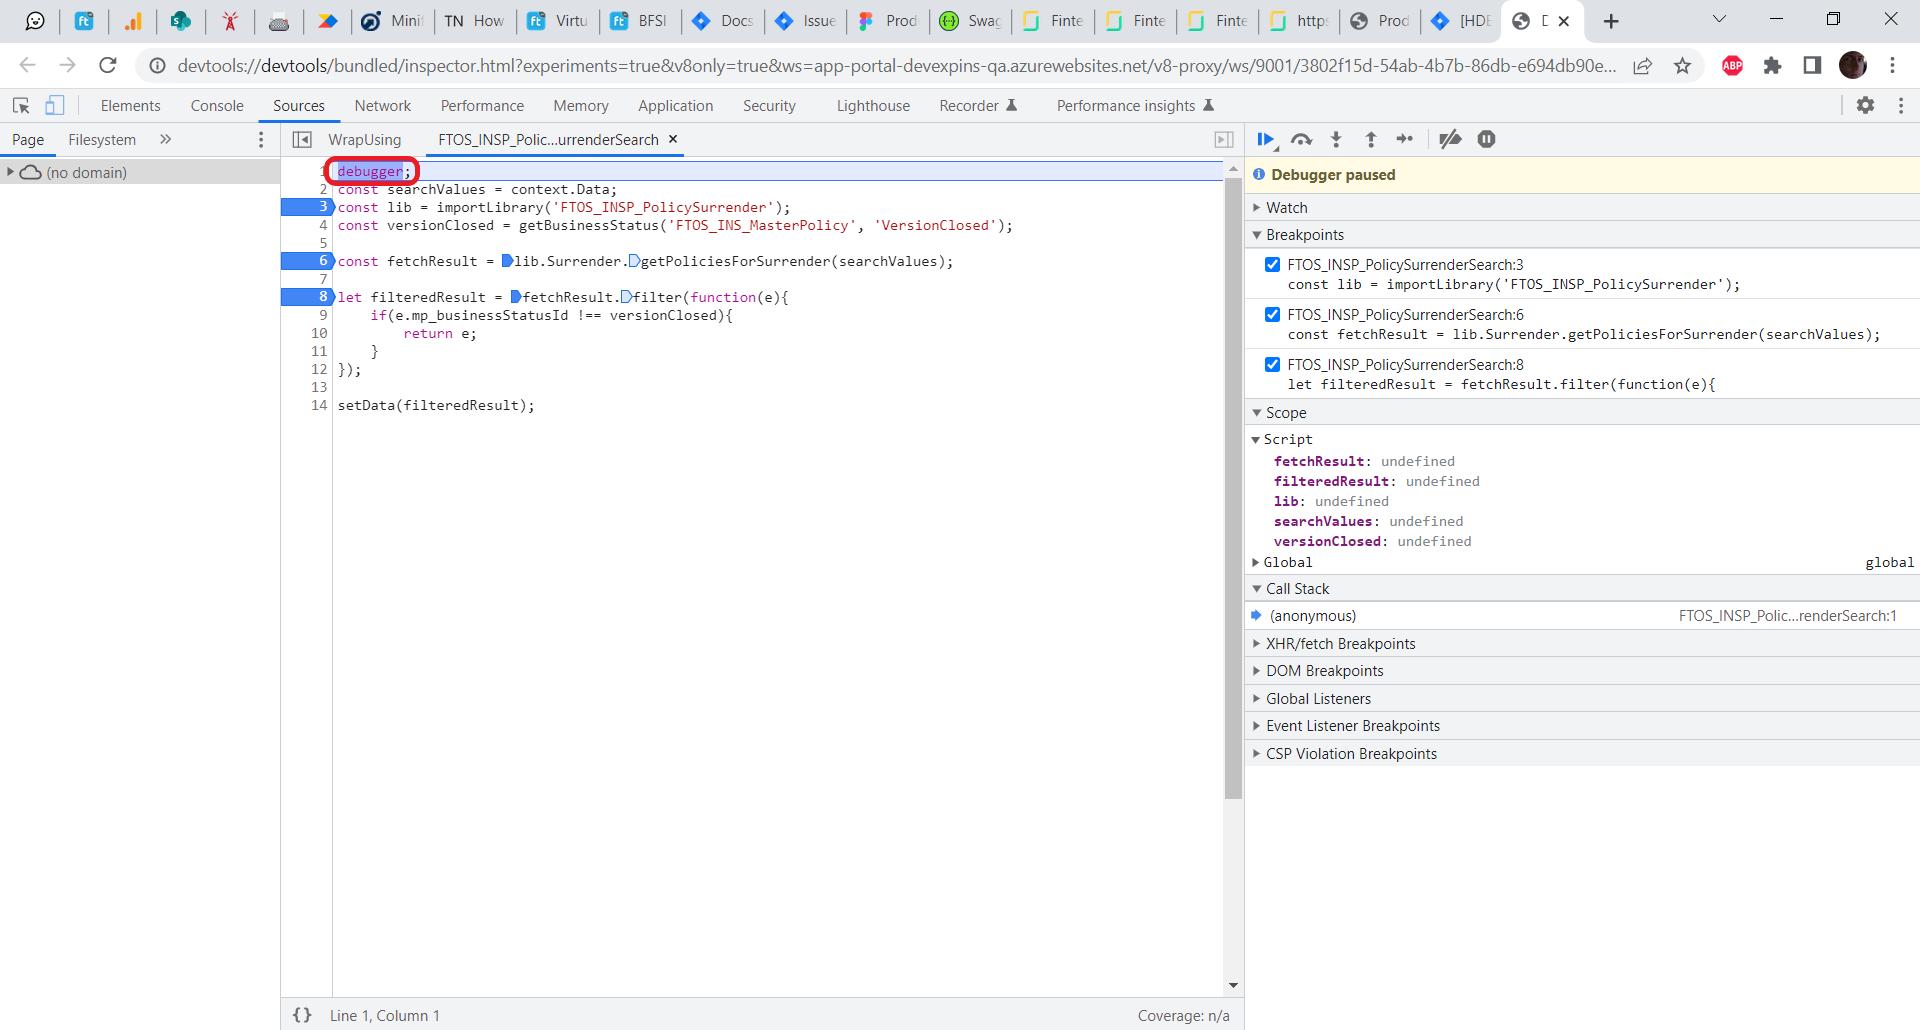
- Start debugging your code using your browser's developer tools.
Debugging Log
The Debugging Log generates log events and continues the code execution. If the code execution breaks due to a throwException or to an unexpected error, the information will be recorded in the log.
Use the log Server SDK function to generate custom log messages from code.
Logging Destinations
The FintechOS platform can send logging information to the following destinations:
- System console
- Local file storage
- A Seq structured log server
- An Azure Application Insights service
For more information, see the Administration Guide.
Logging Context
In addition to the actual log events, you can track the context in which a log event occurred (machine name, portal profile, thread ID, etc.), as well as define your own custom log context properties via server-side scripting (see Custom Log Context Properties). If a default log context property is not protected, you can use the custom log context property functions to edit it.
By default, the following log context properties are recorded:
| Field | Protected | Description |
|---|---|---|
| base-machine-name | Yes | NetBIOS name of the machine that initiated the process. |
| correlation-id | Yes | GUID which correlates the initial call made from one of the internal FintechOS components or from an external client application with the subsequent calls triggered between FintechOScomponents. |
| portal-profile | Yes | Name of the originating FintechOS Portal profile. |
| application-name | Yes | Name of the application where the log event takes place. |
| base-thread-id | Yes | Currently managed Thread ID which generated the log event. |
| djc-form-name | No | Name of the form currently in use. |
| djc-form-id | No | ID of the form currently in use. |
| djc-record-id | No | ID of the business entity record currently in use. |
| djc-record-type | No | Attribute name of the primary key for the business entity record currently in use. |
| djc-journey-name | No | Name of the digital journey currently in use. |
| djc-journey-instance-id | No | ID of the digital journey instance currently in use. |
| djc-activity-id | No | ID of the form section currently in use. |
| djc-activity-type | No | Name of the form section currently in use. |
| djc-activity-instance-id | No | Digital journey instance step currently in use. |
| djc-journey-id | No | ID of the digital journey currently in use. |
For instance, a typical log message may appear like this:
-[START]---------------------------------------
 Timestamp: 17/12/2021 02:10:15 PM
 Message: Record saved successfully.
 Severity: Information
 Exception:
 Properties: { CorrelationId: "23cdb1f5-0529-4377-b200-399efb8bc32f", portal-profile: null, base-machine-name: "FTOSBUCLP385", application-name: "Platform", automationscript: "sample-script-log-api" }
-[END]---------------------------------------
Custom Log Context Properties
To set up your own custom log context properties use the following Server SDK functions:
| Function | Description |
|---|---|
| server.logging.setProperty | Sets a custom log property to be included in log messages. |
| server.logging.getProperty | Retrieves the value of a custom logging property. |
| server.logging.clearProperty | Clears the value of a custom logging property. |
| server.logging.isPropertySet | Checks if a custom logging property has been defined. |
Throw Exceptions
Break the automation script execution and display the message as specified within the throwException statement.
When the throwException method is called in an automation script, the passed error message is available to users.
Examples of how throwException can be used for debugging purposes:
throwException(serialize("test"));
throwException(serialize(result.TotalNetProfit));
throwException(serialize(context));
throwException(String(Topic[0].a_Topic));
throwException(JSON.stringify(result));
throwException(JSON.parse(result));
JavaScript Exceptions
When parsing invalid Xml in automation scripts, JavaScript Exceptions are caught by try catch in JavaScript:
try
        {
        // load invalid XML
        var doc = server.Xml.Load( '<a> ... <' );
}
catch(err)
        {
        // handle error
 }
Console Debugging
Server-side errors are displayed by the developer tools. During development and testing phases, developers are able to track errors raised on the server-side directly in the browser's Developer Tools.
Example browser developer tools to use for debugging automation scripts:
The error output displayed in the Console is particularly useful when raising issues. Include the error output in the issue description to provide a complete overview of the error and reduce the investigation time.
Console debugging can be used only on development machines and in testing environments.
For IISExpress, on the development machine, open an elevated Command Prompt and run the following command:
C:\work\EBSCore\current>SETX\ebs-development-mode 1
For IIS, make sure that you set the variable at the system level (not on the user level):
C:\work\EBSCore\current>SETX\ebs-development-mode 1 /m
To debug on testing environments, open the web.config file in a text editor and add the following section:
<appSettings>
     ...
    <add key="ebs-development-mode" value="1 "/>
</appSettings>