Observability & Telemetry
With v.22.1.4, FintechOS incorporates Grafana into the observability solution. Grafana is an open-source analytics & monitoring platform, which allows users to see their data in charts and graphs that are aggregated into one (or multiple) dashboard(s) for easy interpretation and understanding. Grafana includes built-in support for Azure Monitor data source, useful when monitoring the FintechOS - Azure infrastructure services. Data is gathered from all Azure resources and FintechOS applications, and the entire set of Azure Monitor and Grafana features enable you to monitor application performance.
1 Authentication & Roles
Grafana inherits the FintechOS Identity Provider for authentication and is by default configured to reside in a subdomain of your FintechOS environment, so once you are logged in FintechOS Studio or Portal, login is done automatically. Grafana roles need to be created in FintechOS Studio and are then included through scripting in the IDP token at deployment.
There are three types of permissions associated with Grafana roles:
-
Viewer - allows the user to authenticate in Grafana, but they cannot see any dashboards. To grant read-only access, the role viewer must be allocated per dashboard in Grafana.
-
Editor - provides read-write access to the dashboards in the instance.
- Admin - provides full control of the instance including viewing, editing, and configuring data sources.
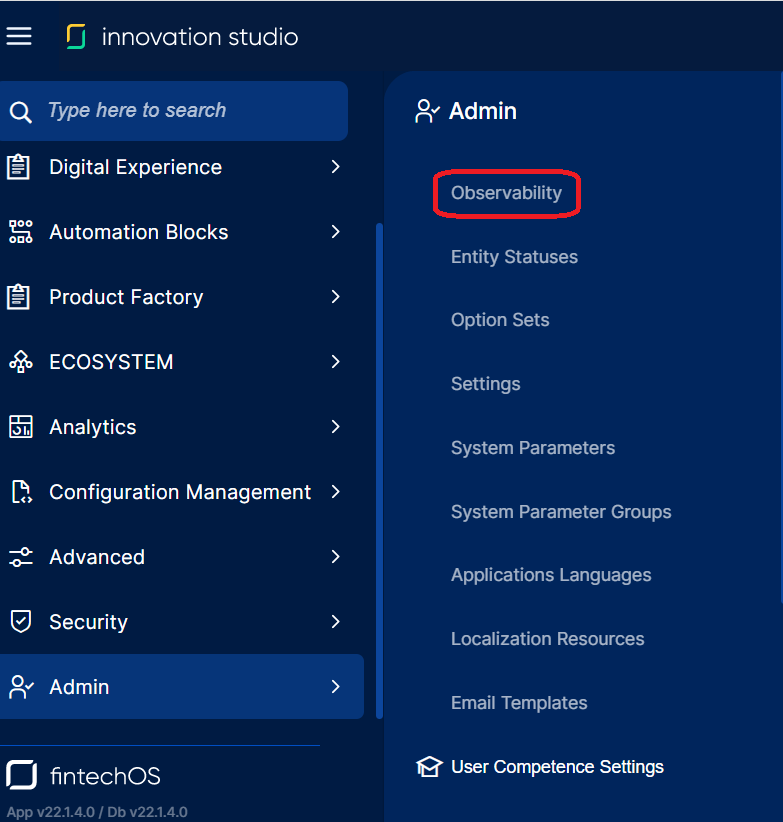
Also, in FintechOS Studio, you need to use the "Observability" security role to map a connection between your established roles and the Observability menu item displayed in the UI. For more details on security roles, see FintechOS Studio User Guide.
To open Grafana, from the FintechOS Studio main menu, navigate to Admin and select Observability. This opens the Grafana web application in a new tab.
2 Dashboards
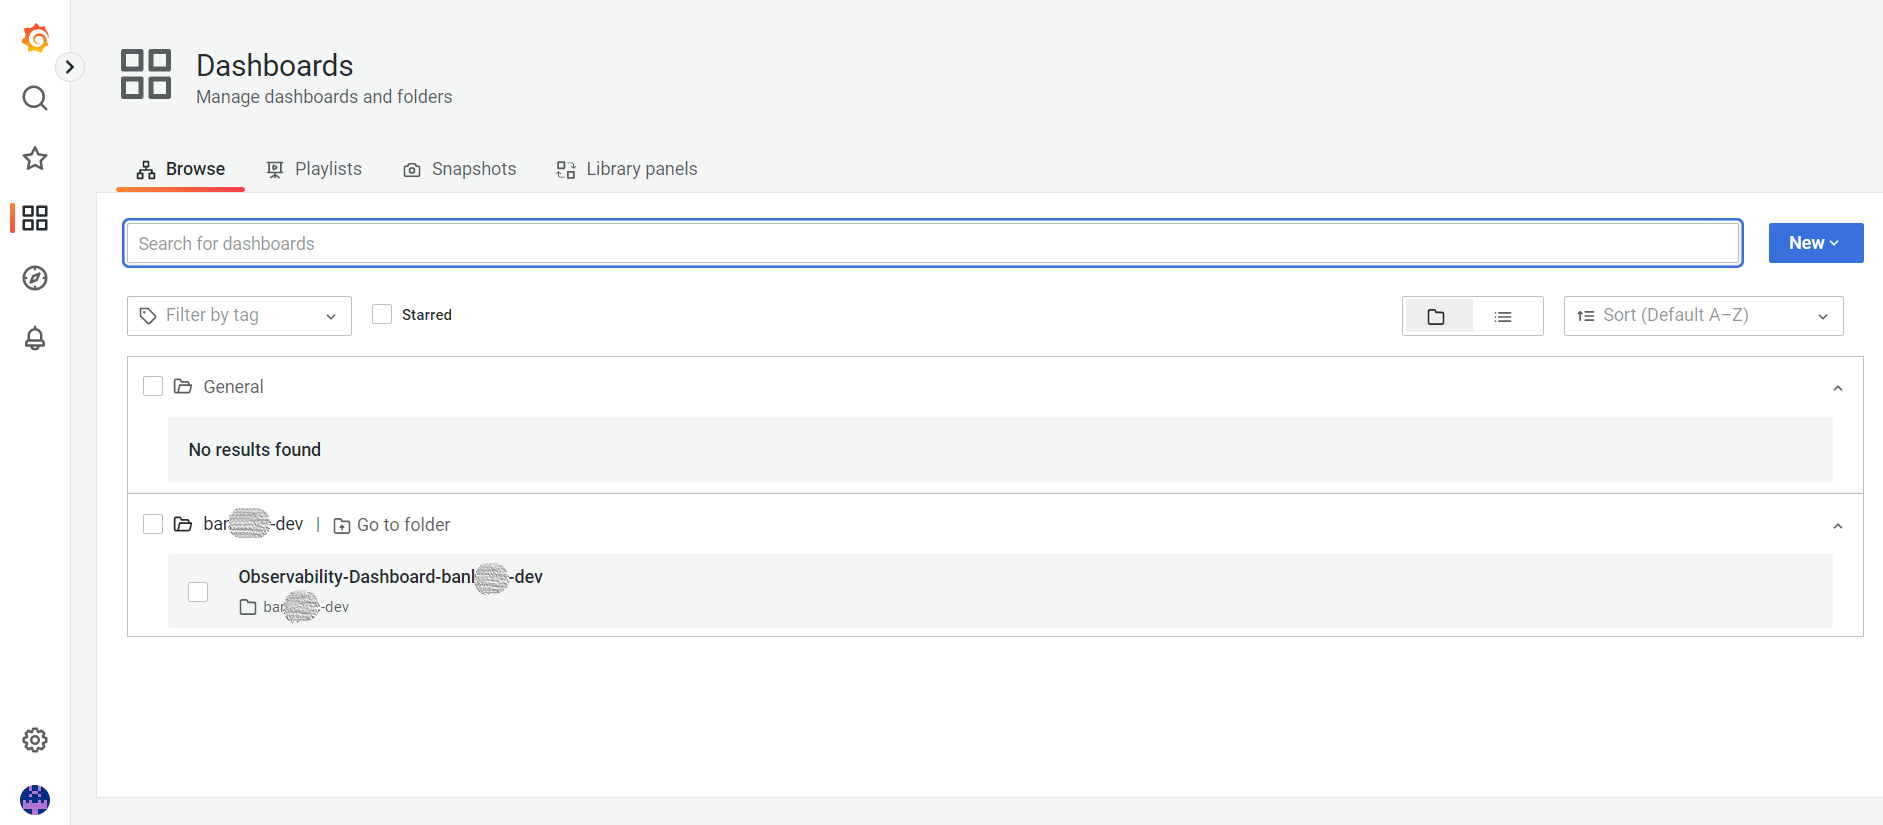
A dashboard is a set of one or more panels organized and arranged into one or more rows. Each panel provides data from a specific FintechOS data source. Dashboards can be organized and grouped into folders. You reach the dashboard folder page by hovering over a result in the dashboard search, or on the Manage dashboards page.
During environment deployment, two dashboards are created and configured automatically: a default dashboard and a business dashboard.
Default dashboard
This dashboard contains the default setup of metrics for monitoring FintechOS - Azure services and application performance, and is structured on the following panels:
Monitoring Metrics
WebApps (for FintechOS components and Business Components)
-
CPU_Percentage_Portal
-
CPU_Percentage_MFE_CAMEL_OpenAPI
-
Requests_Portal_Studio_B2CPortal
-
CPU_Percentage_B2CPortal
-
CPU_Percentage_Envoy
-
Requests_JobServer
-
CPU_Percentage_Studio_JobServer
-
HTTP_5xx_Portal_Studio_B2CPortal
-
ResponseTime_Portal_Studio_B2CPortal
-
ResponseTime_JobServer
-
ResponseTime_Camel_Envoy
AzureInsights
-
TraceRoll (for FintechOS components)
-
AppRequests
-
AppRequestsDuration
These metrics are described here: Monitor apps - Azure App Service.
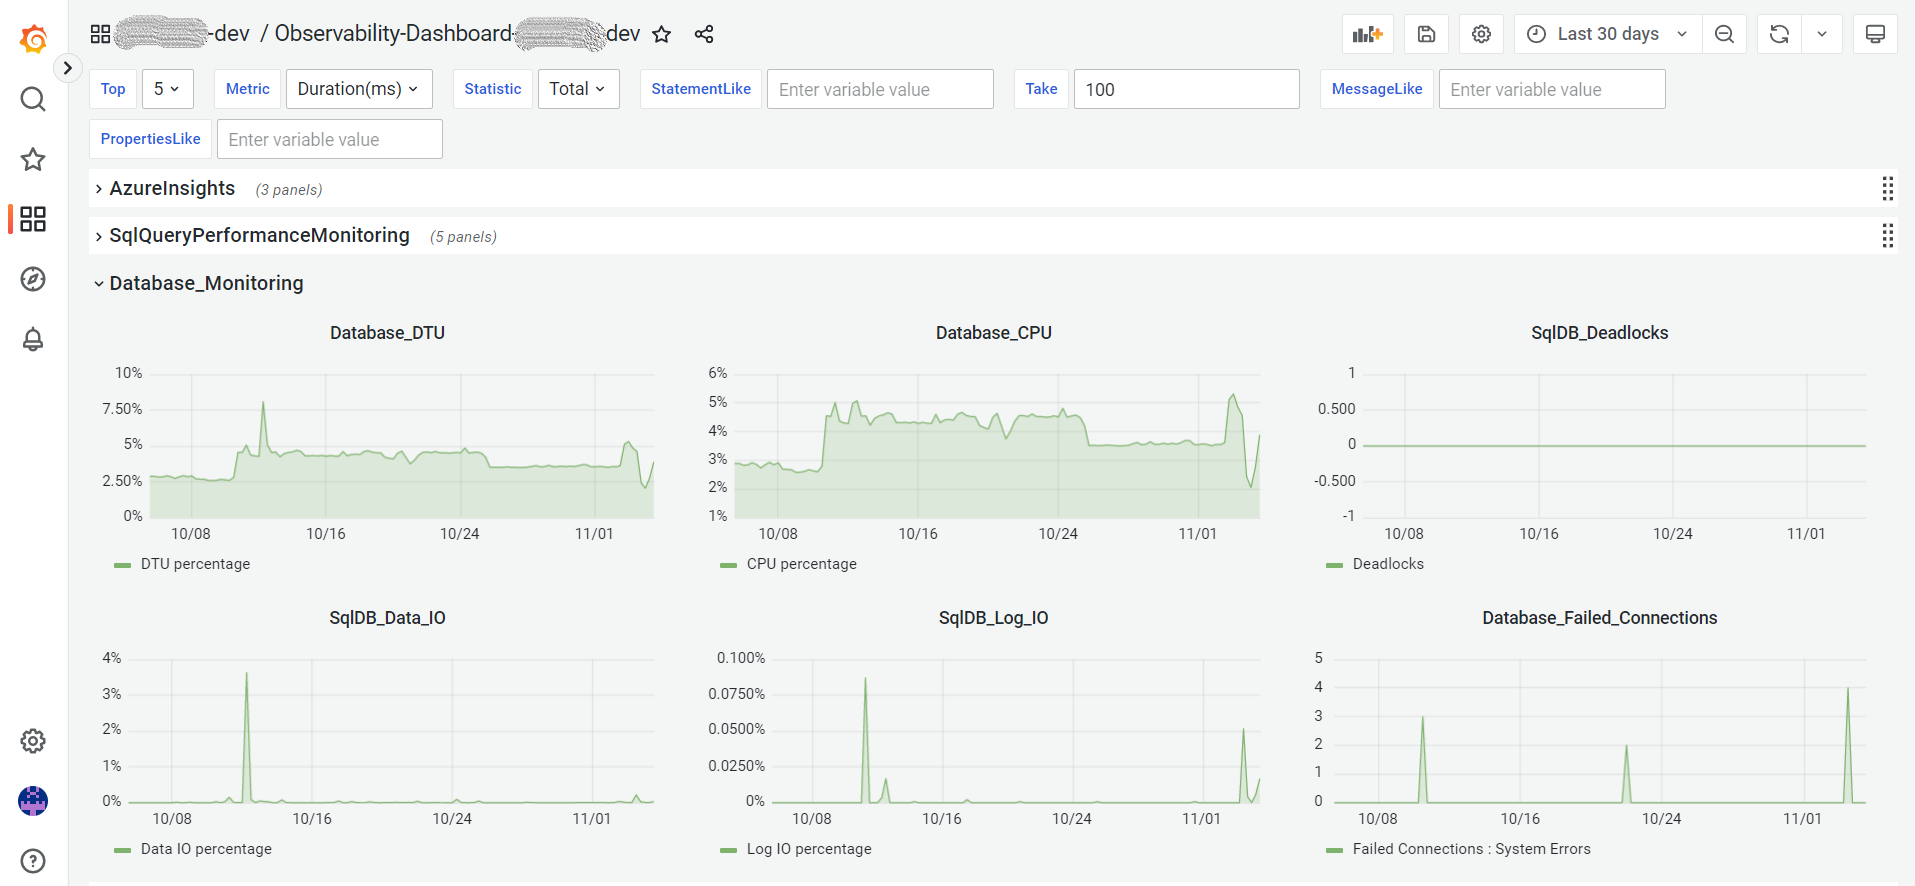
Database
-
Database_DTU
-
Database_CPU
-
SqlDB_Deadlocks
-
SqlDB_Data_IO
-
SqlDB_Log_IO
-
Database_Failed_Connections
SqlQueryPerformance
-
TopResourcesConsumer
-
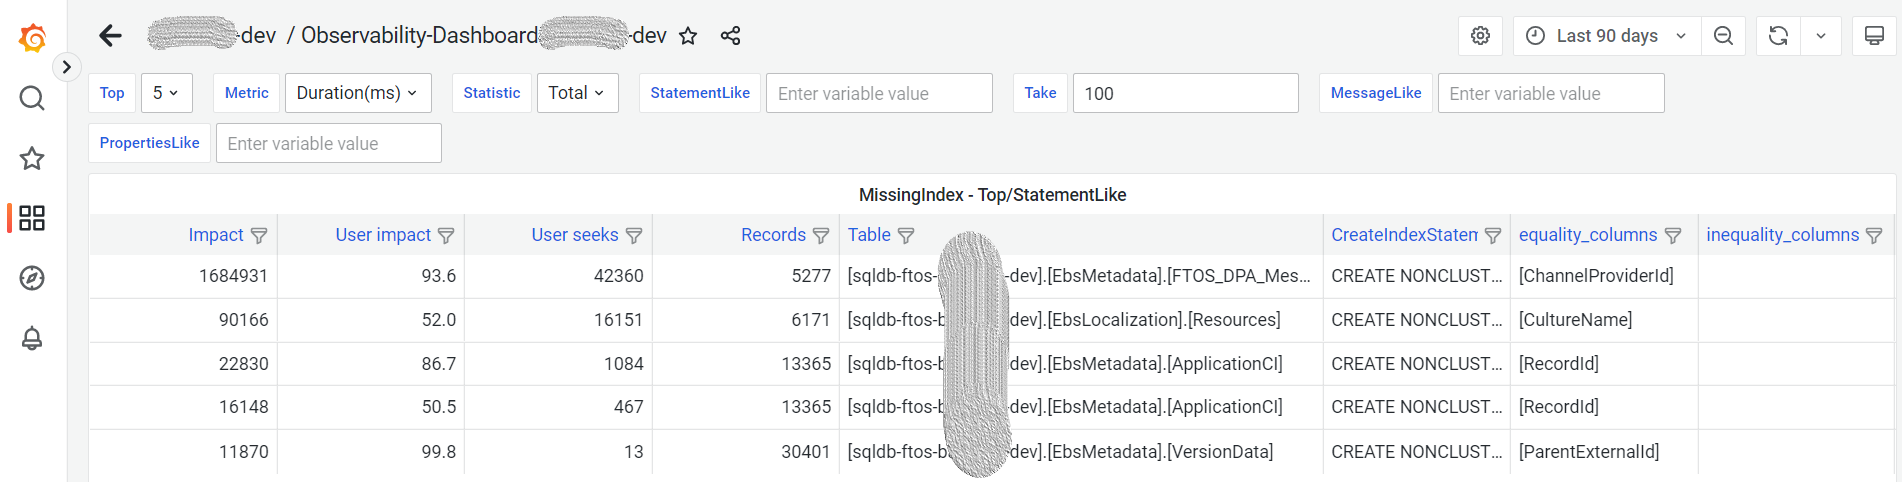
MissingIndex
-
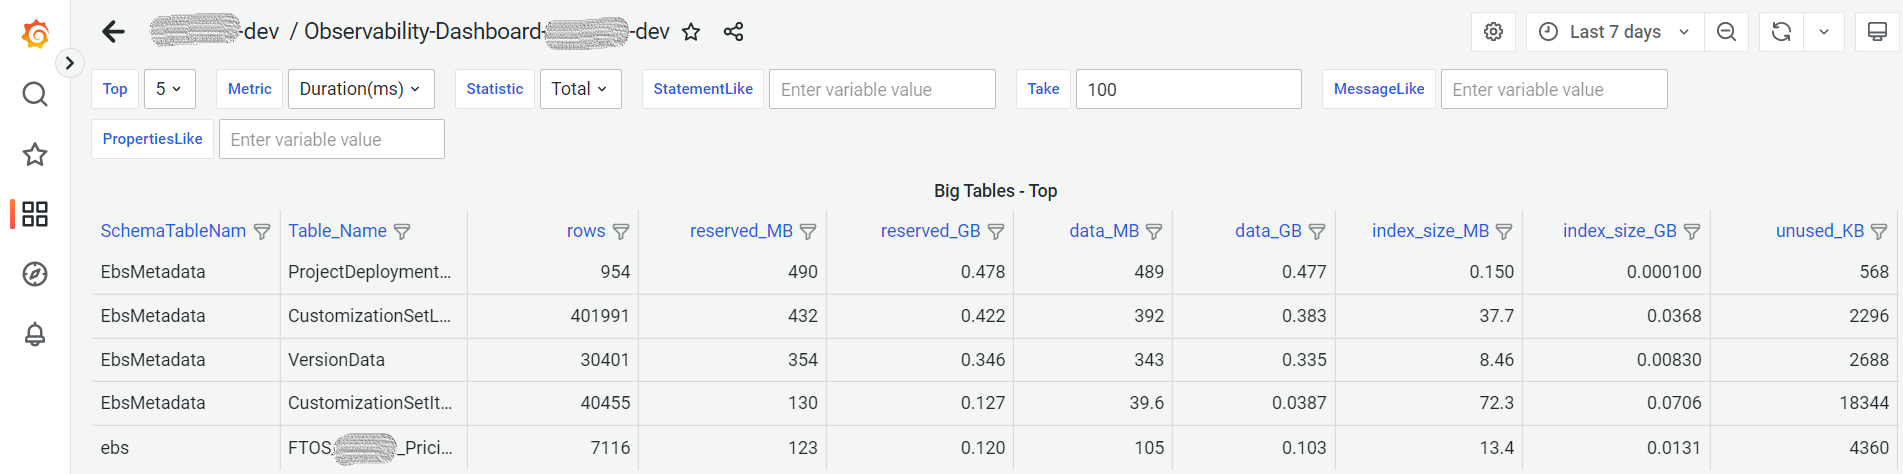
Big Tables
-
Deadlocks
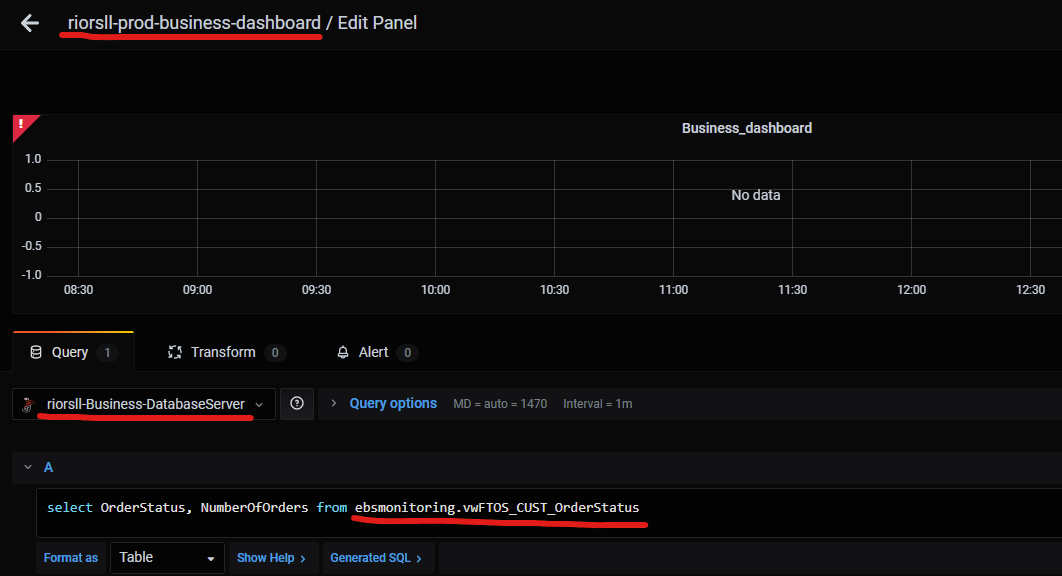
Business dashboard
The business dashboard works like a frame you can use during the project implementation phase, where you can create different monitoring panels based on your specific business needs. For this, a special data source was created with the following naming: production_client_name-Business-DatabaseServer. The only permission of the database user that this data source uses is the 'Read' permission on the ebsmonitoring schema.
3 Search & Filtering
Grafana allows for extensive search and filtering options so you can customize your queries and get specific data. For example, you can type a variable value in the MessageLike field, and you will get only the TraceRoll logs that contain that specific value: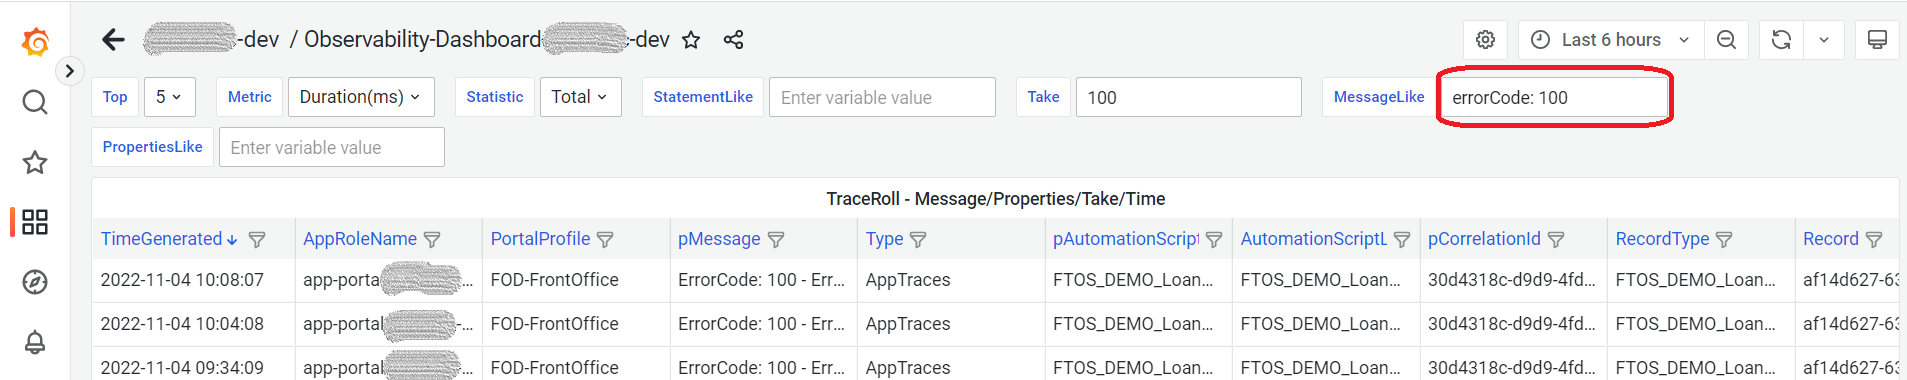
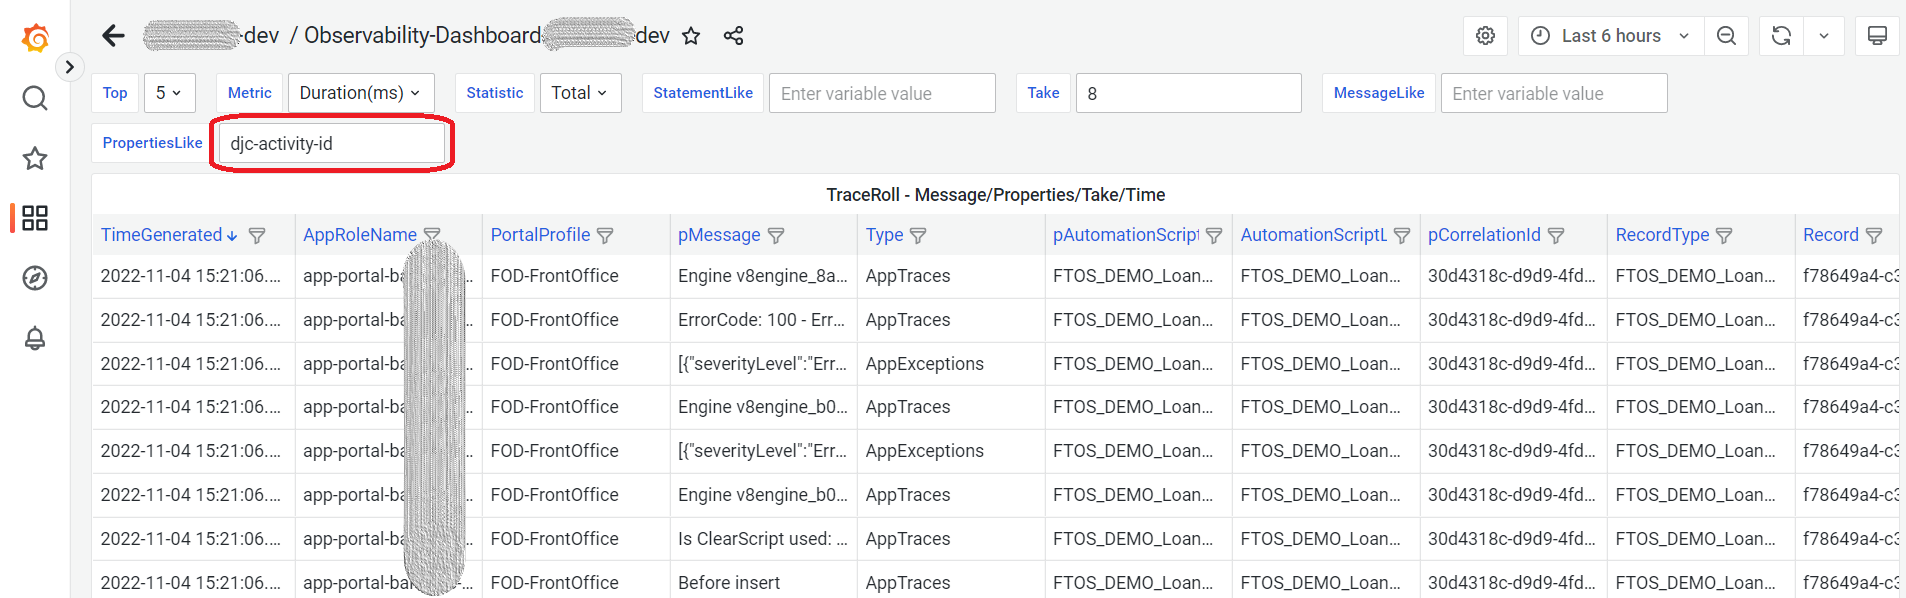
You can also limit the number of rows displayed in the results with the Take field, filter columns by value, or refine your query with the PropertiesLike field:
4 Examples
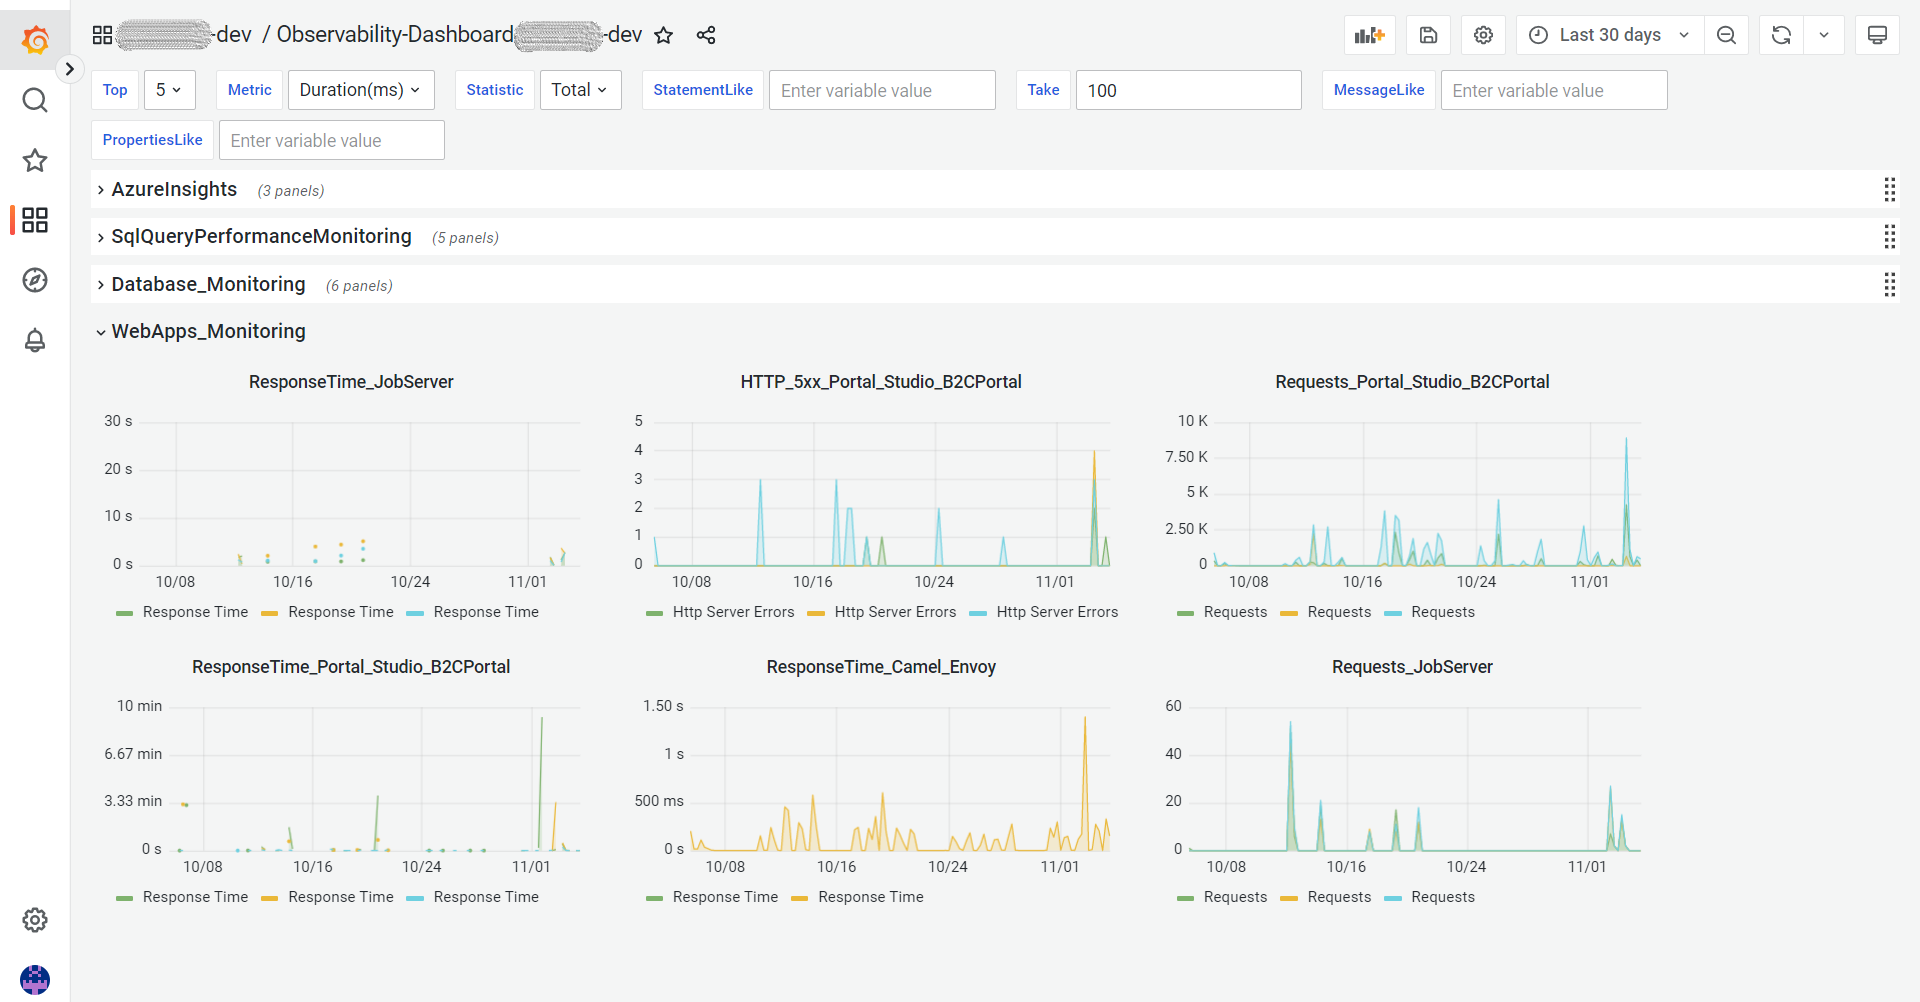
Below are the various panels displayed in Grafana for a production environment, with time intervals ranging from hours to the last three months.
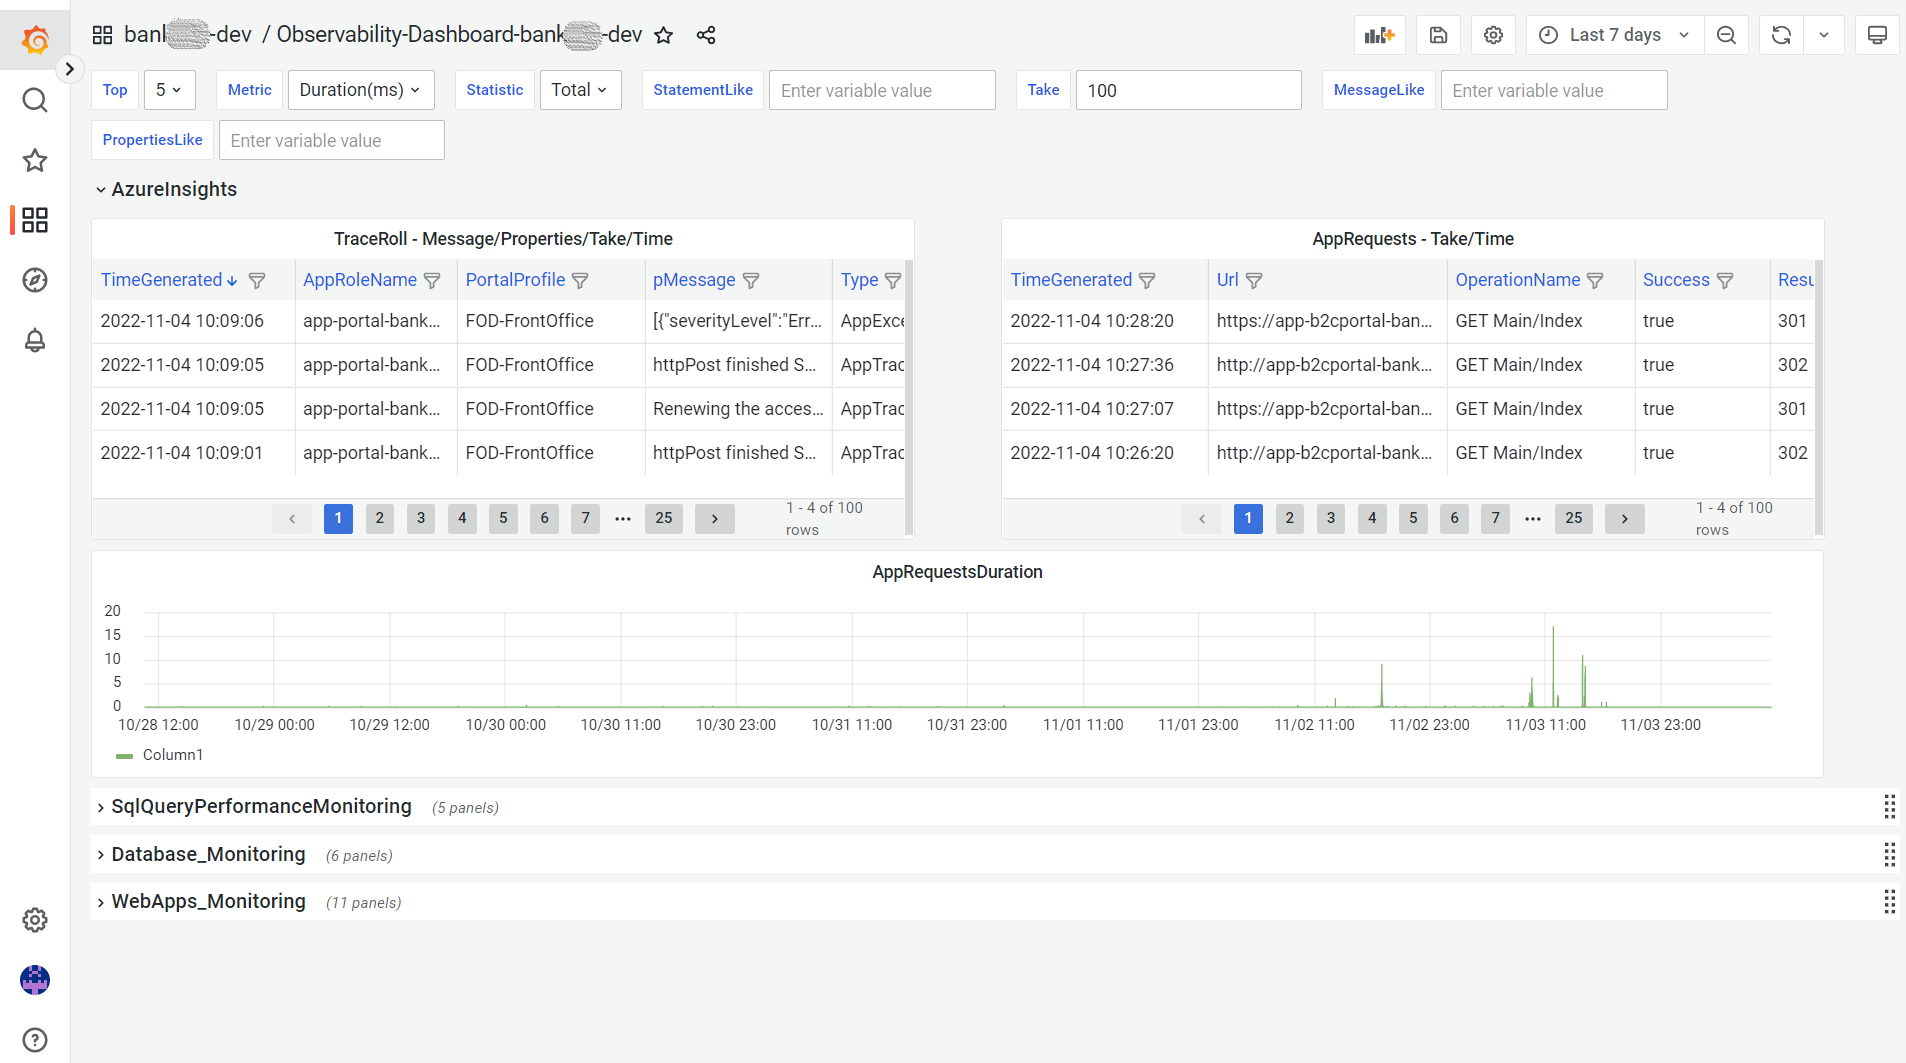
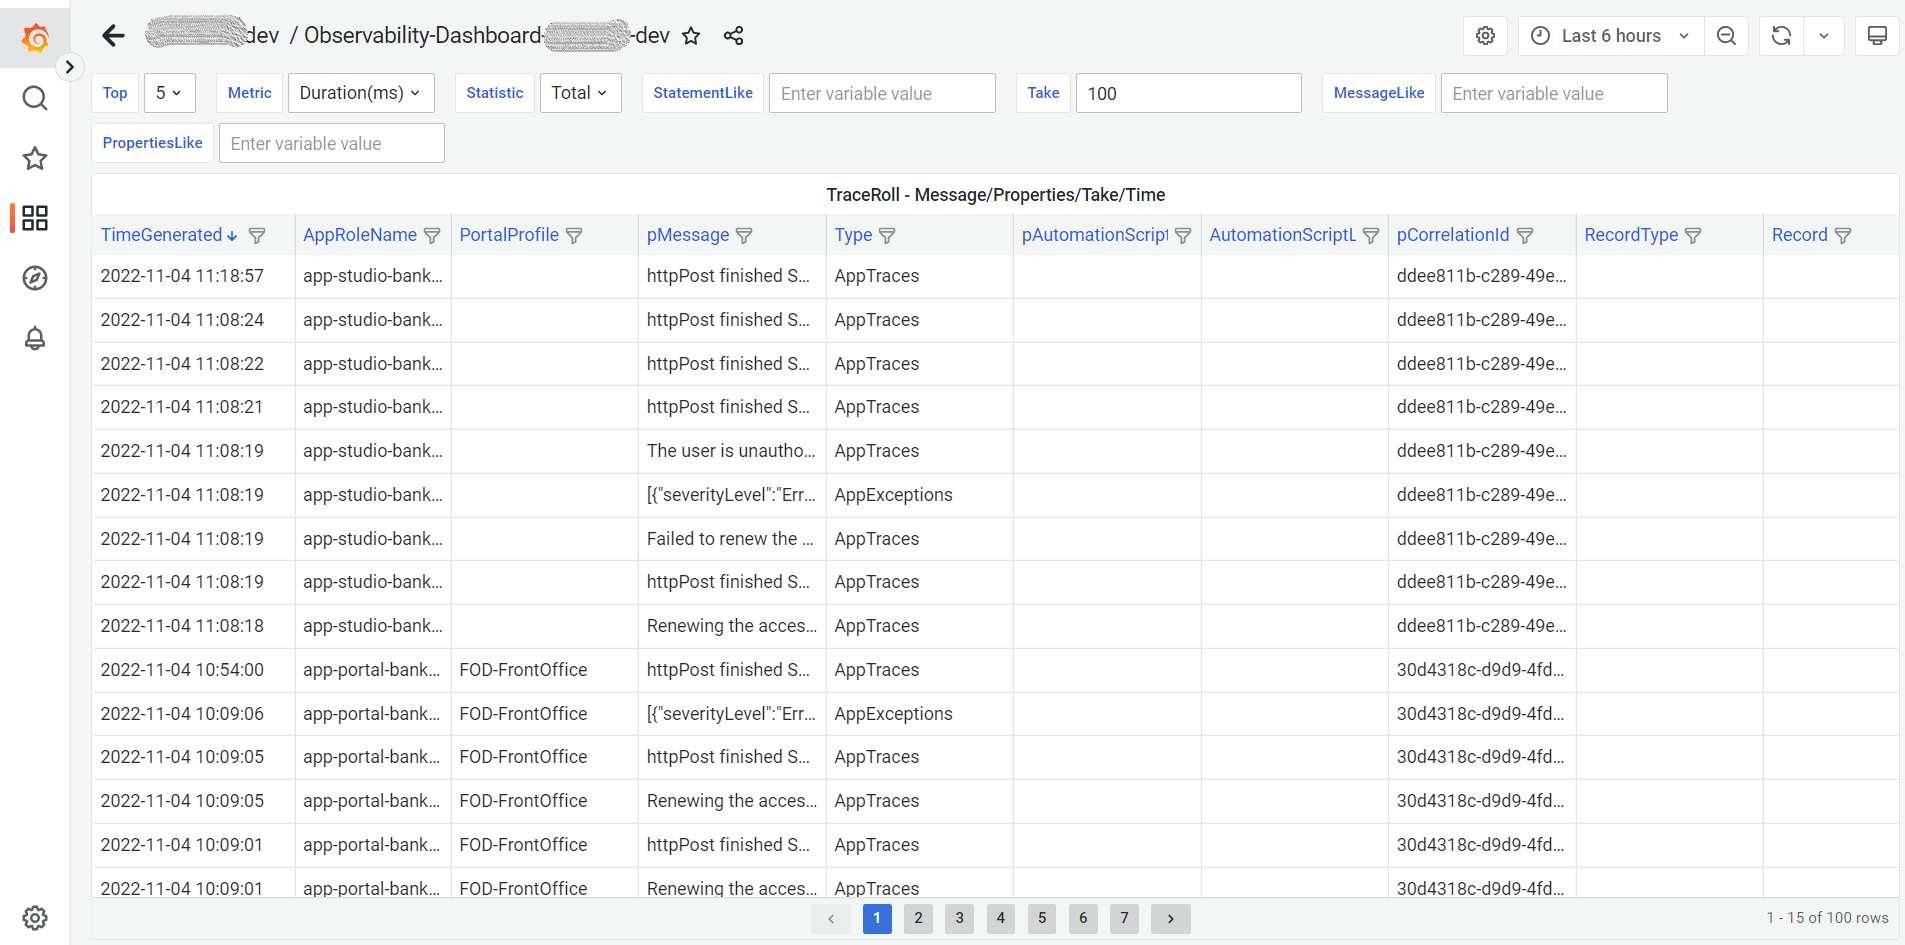
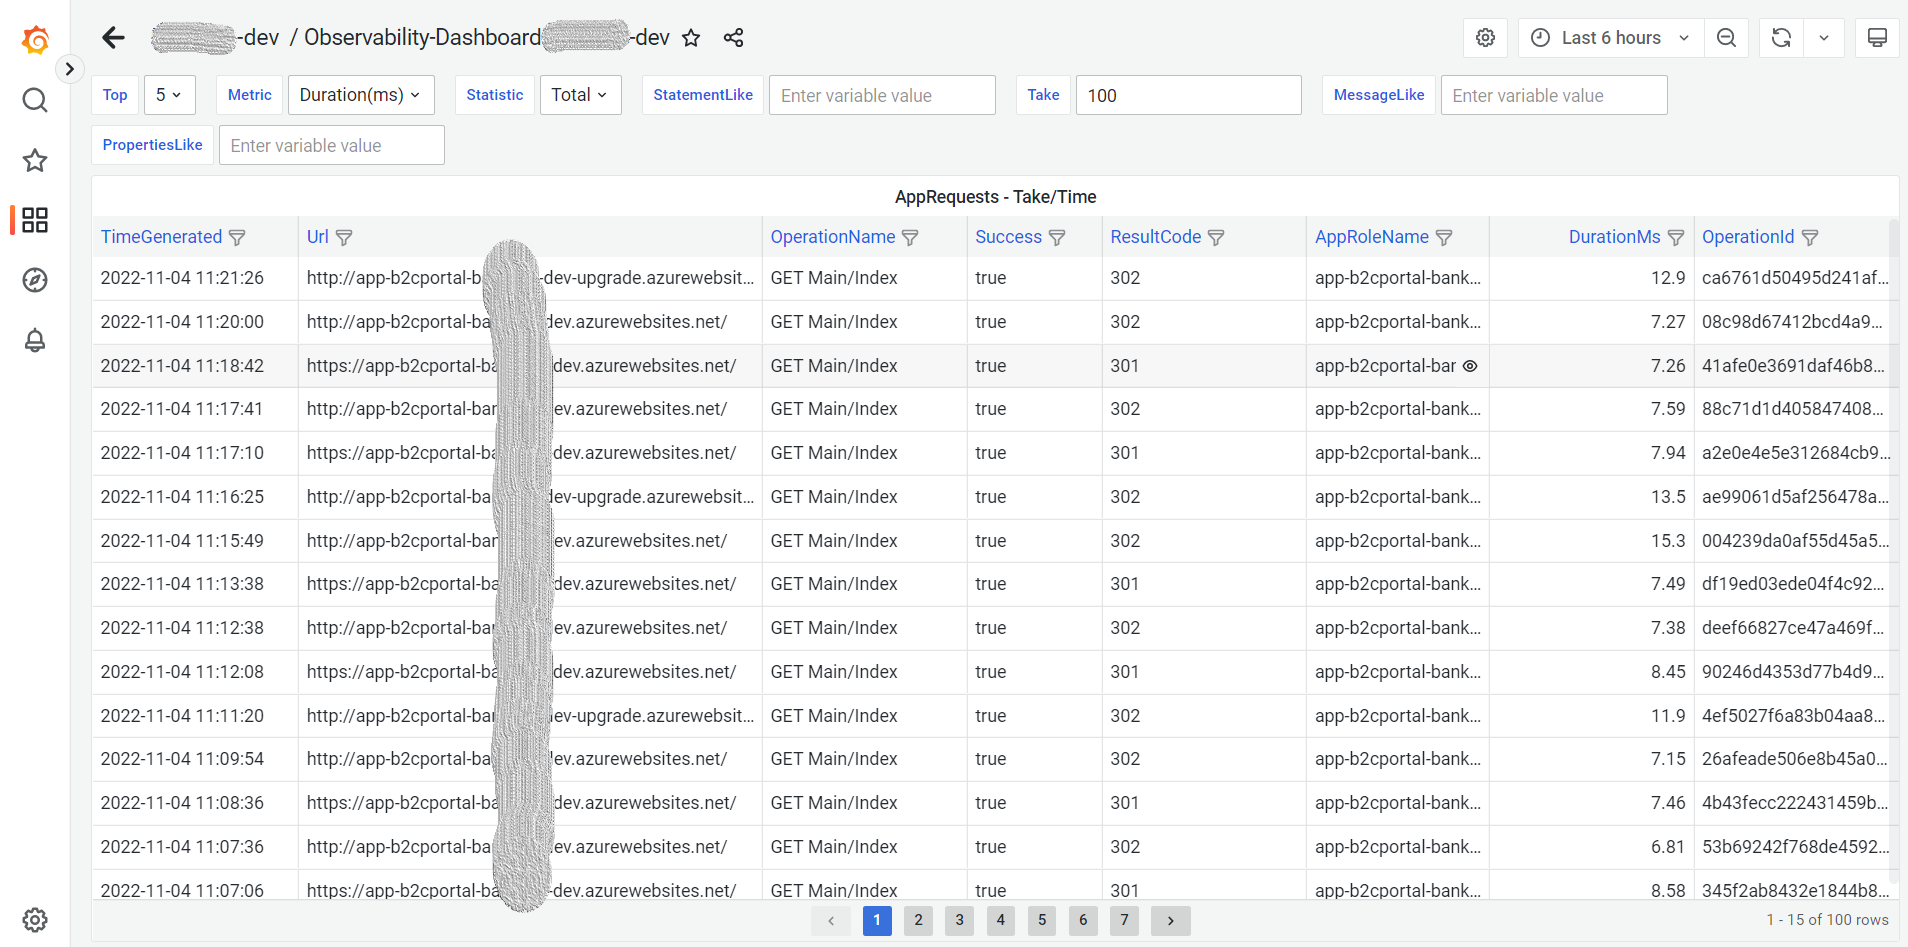
AzureInsights
TraceRoll - Message/Properties/Take/Time , AppRequests - Take/Time
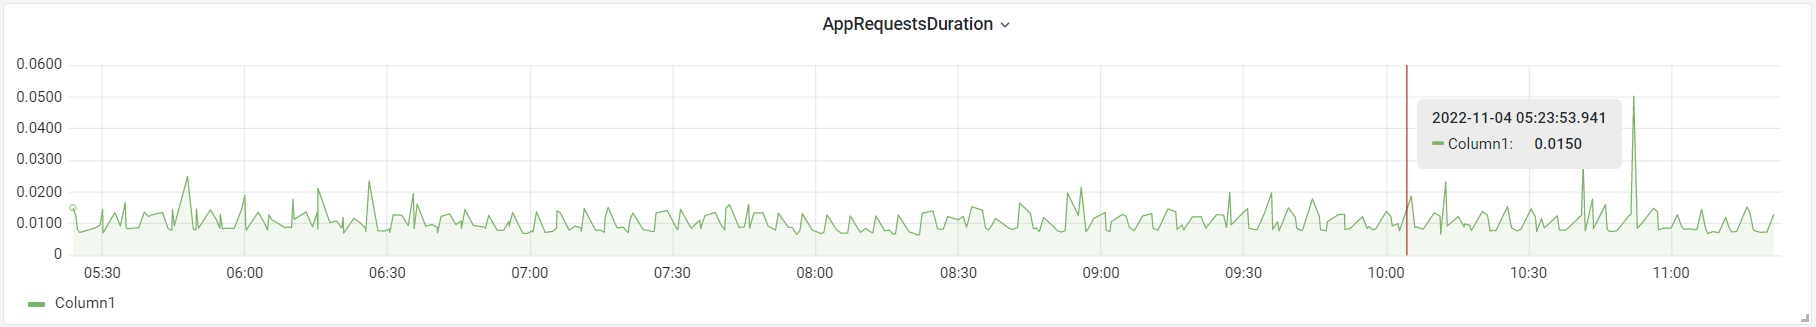
AppRequestsDuration
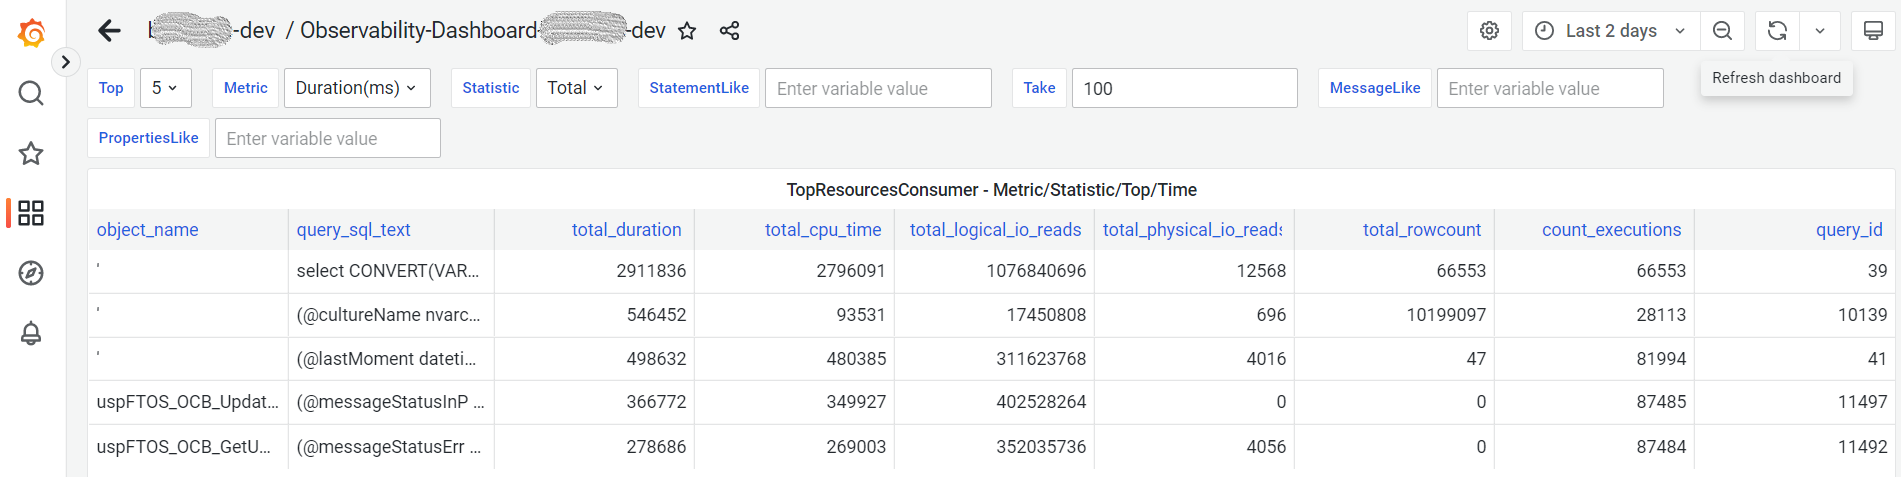
SqlQueryPerformanceMonitoring
TopResourcesConsumer - Metric/Statistic/Top/Time
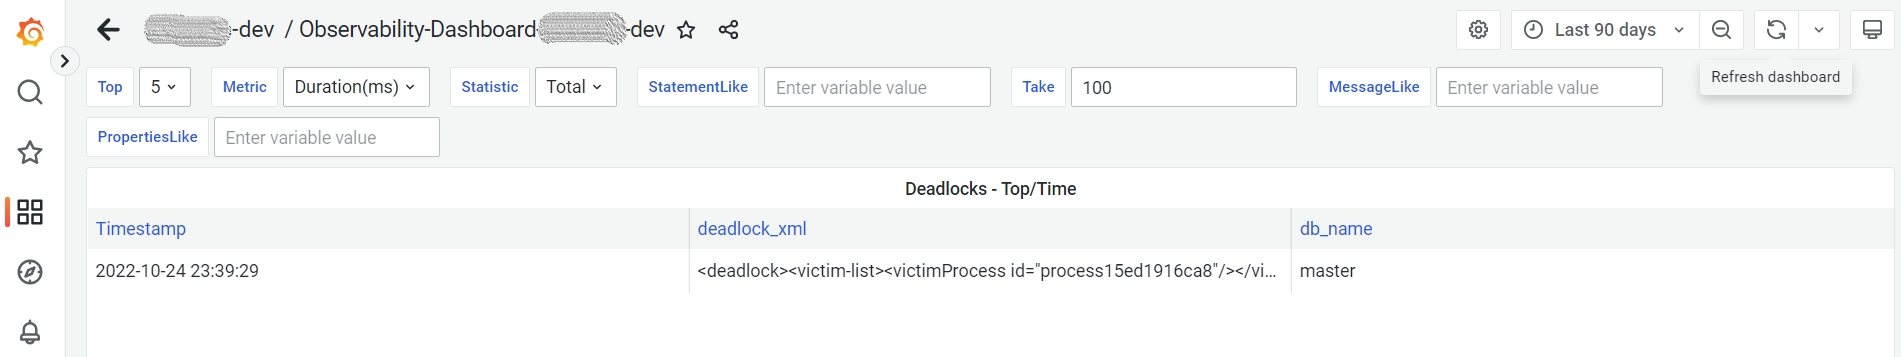
Deadlocks - Top/Time
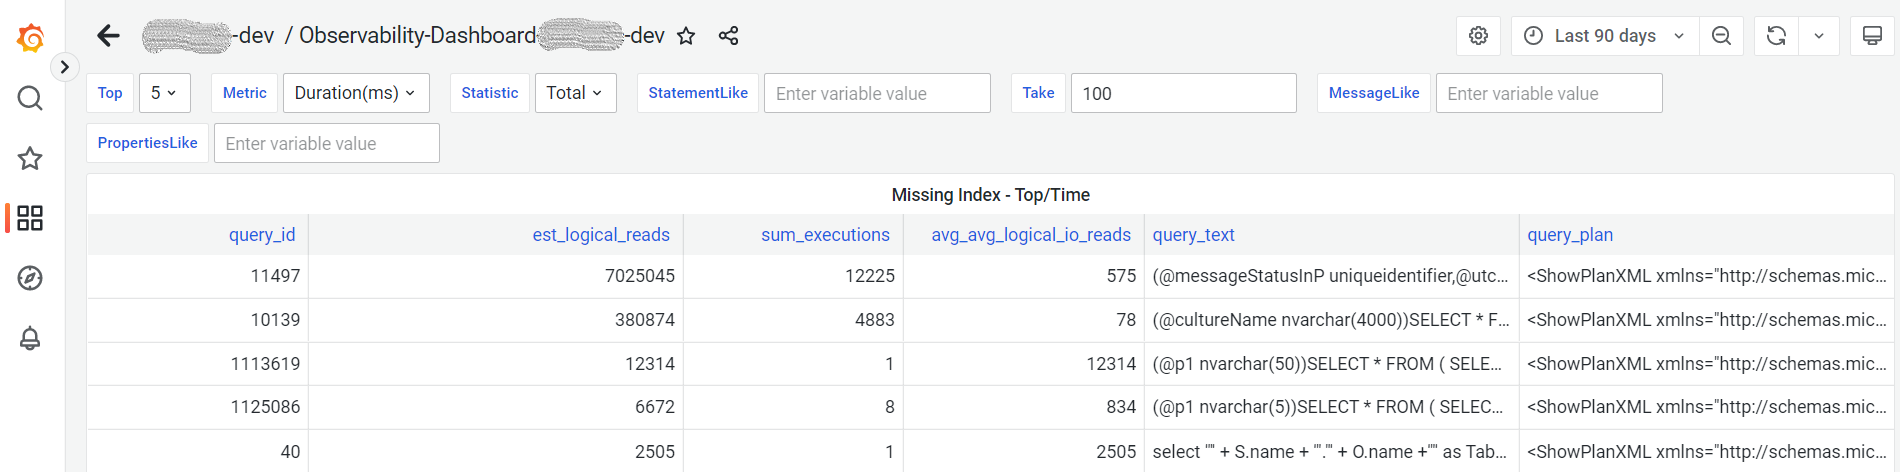
MissingIndex - Top/StatementLike , Missing Index - Top/Time
Big Tables - Top
Database_Monitoring
WebApps_Monitoring