Manage Analytics
At the customer's account level, information related to the account transactional profile is displayed in the Analytics tab. Here, relationship managers can filter customer payment information through the Charts, Pivot, and Indicators tabs.
The information displayed is retrieved only from external sources via mechanisms supported by the FintechOS platform.
Filter the data displayed on the dashboards through the below options:
-
Start and End: Enter the start date and the end date for the displayed period.
-
Direction: Select from the following options:
- Incoming: for the payments received in the customer's account.
- Outgoing: for the payments sent from the customer's account.
-
Volume: If selected, then the total volume of data is displayed.
-
Count: If selected, then the total count is displayed.
-
Indicator: Select what indicators to be displayed from the following options: ATM withdrawals, ATM/ MFM transaction, Cash deposits, Cash withdrawals, DD transaction, Electronic payments, OP incomings, Paper based payments, Payment with card or SO transactions.
NOTE
The above indicators are default. You can define indicators based on your business needs. -
Inter/ Intra: Select from the following options:
-
Inter: for transfers made into the account of a different bank.
-
Intra: for transfers made into accounts withing the same bank.
-
-
Currency: Select the currency displayed from the following options: CHF, EUR, GBP, RON or USD.
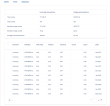
Based on the above filters, the data populates on the Charts, Pivot, and Indicators tabs.
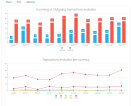
This tab displays the incoming and outgoing transactions evolution and the transactions evolution per currency in a pie bar chart.
The bar chart uses the drill-down feature to view information at each indicator level. Click on a bar to see additional data. To return to the initial chart, use the back button.
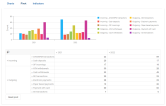
The pivot chart allows relationship managers to analyze transactional data at the customer's account level. The data from the chart changes based on the filter used in the pivot but also depending on the indicators displayed when using the drill-down feature.
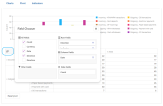
Filter the way the data is displayed, by selecting the Show Field Chooser option. The pivot filter is displayed with the following default setting:
- The row fields display the Direction, Indicator, and Inter/ Intra fields.
- The column fields display the Date field.
- The data fields display the Count field.
Customize the data based on the needed information. To return to the default pivot settings, click Reset pivot.


