Product Factory
Product Factory is a central hub for managing banking and insurance product portfolios. Its intuitive, sentence-based product designer enables you to create products by customizing product types tailored to various business requirements. Once a product design is finalized, you can test it, approve it for production, bundle it within commercial offers, track its performance using analytics, and enhance it through iterative updates and successive versions.
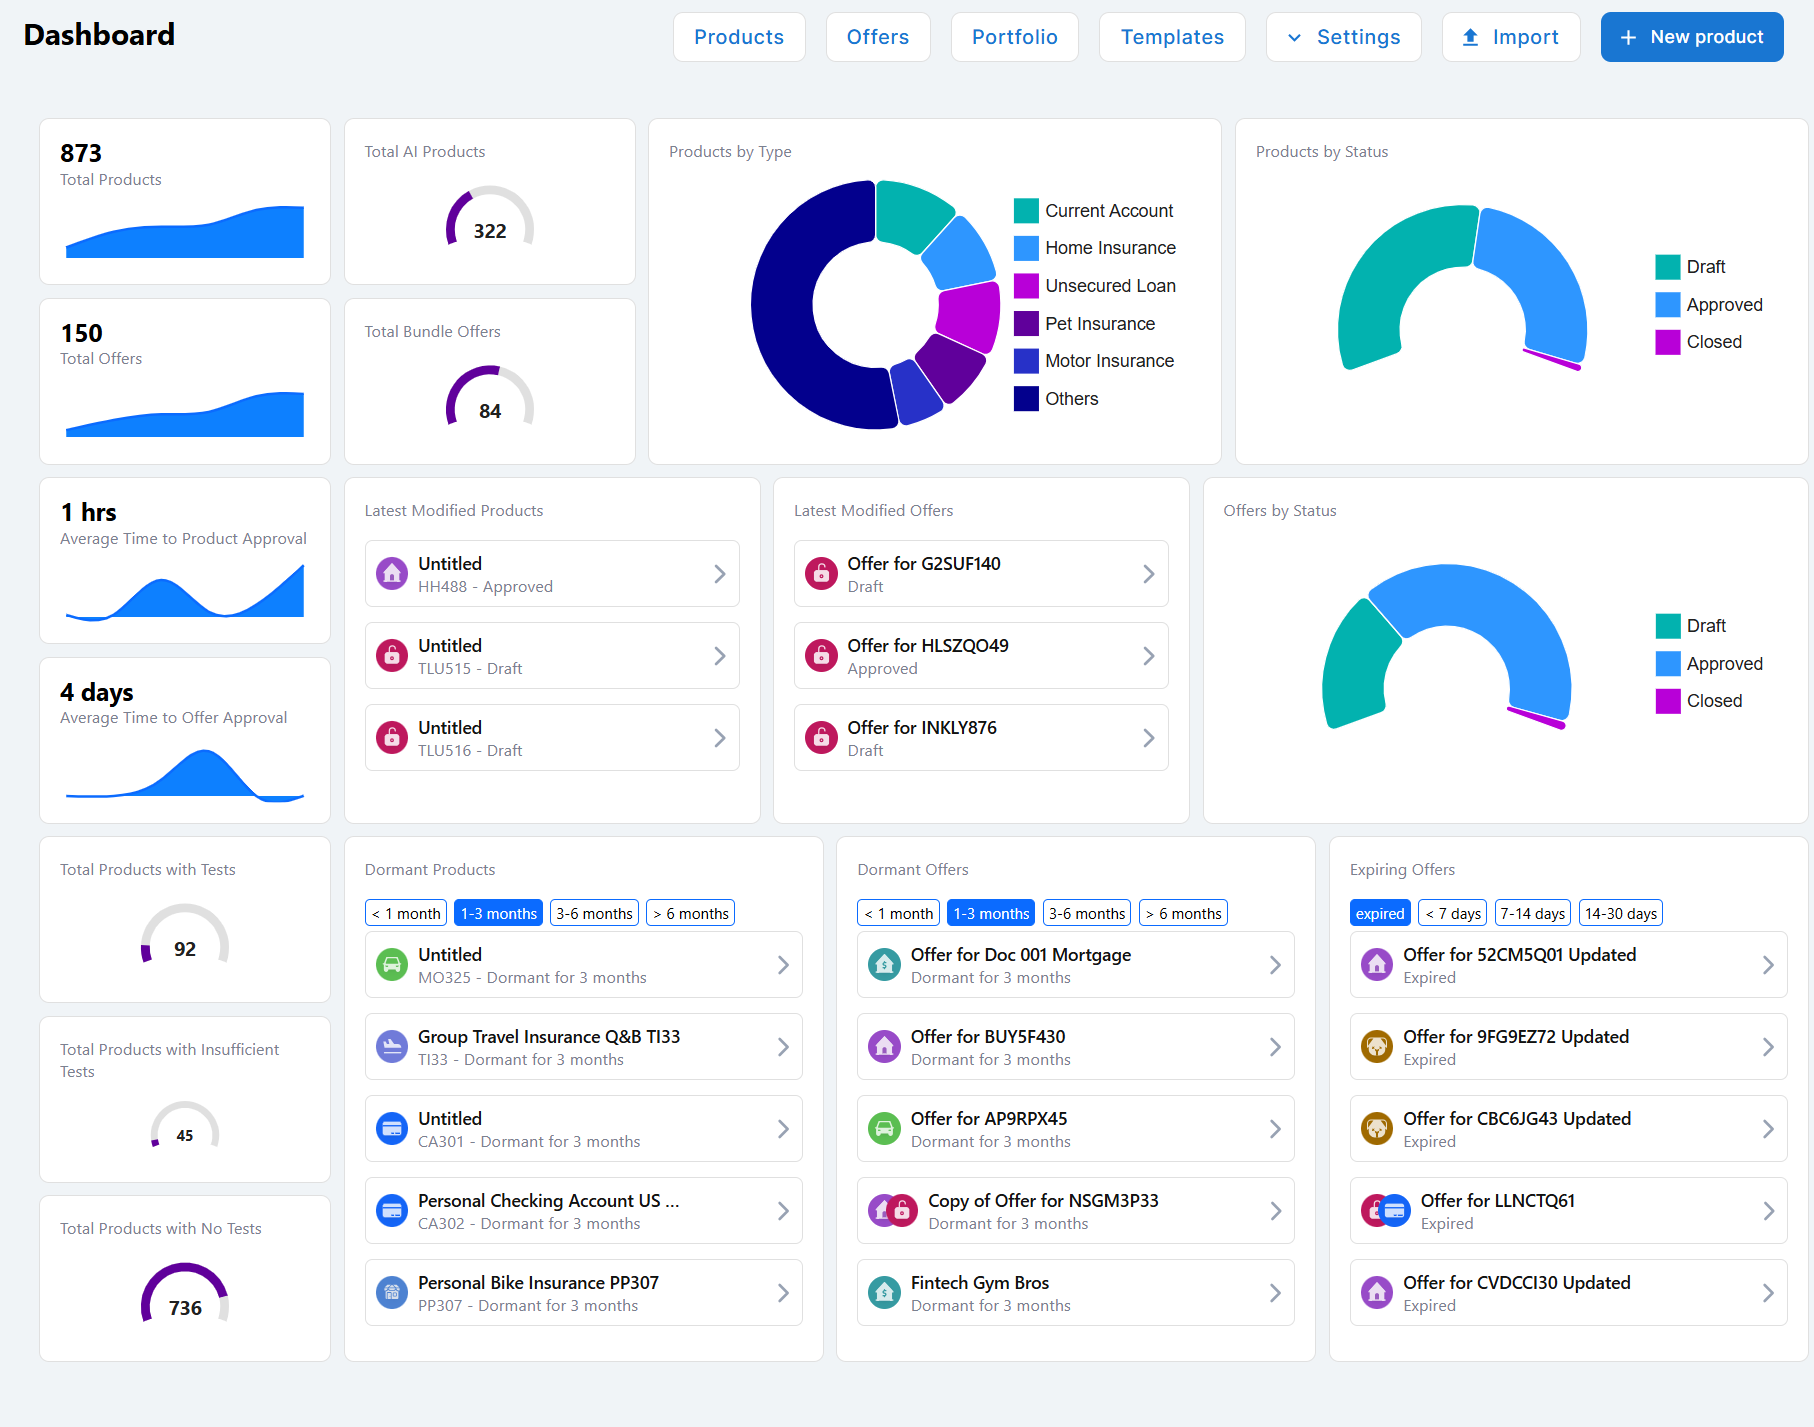
To access Product Factory, in FintechOS Studio, go to Main Menu > Products > Products. This opens a dashboard with navigation links to the main capabilities along with visualizations for key product and performance metrics.
Product Dashboard Navigation Links
The following navigation links are displayed at the top of the Product Factory dashboard homepage:
- Products - Opens the Product List, which allows you to browse and access the products configured on your environment.
- Offers - Opens the Offers page, where you can manage product offers.
- Portfolio - Opens the Portfolio (Product Analytics) page, which allows you to monitor product sales performance.
- Templates - Browse Templates that illustrate the capabilities and configuration options for various product types.
- Settings - Configure Product Settings available for features like payment schedules, collateral types, insurance perils, fee types, or interest indexes.
- Import - Opens the Import Products UI, which enables you to import product definitions via standardized JSON files.
- + New Product - Allows you to select a product type and Create Products based on that type.
Product Dashboard Visualizations
The following visualizations are displayed on the product dashboard:
- Total Products - Number of products currently defined in Product Factory. The sparkline chart represents the cumulative product count over time.
- Total Offers - Number of Offers currently defined in Product Factory. The sparkline chart represents the cumulative offer count over time.
- Average Time to Product Approval - Average time a product spends in Draft state before approval (see Product Life Cycle and Replication). The sparkline chart represents the evolution of the average time required for product approval over time.
- Average Time to Offer Approval - Average time an offer spends in Draft state before approval (see Offer Life Cycle). The sparkline chart represents the evolution of the average time required for offer approval over time.
- Total Products with Tests - Number of products with test cases defined (see Product Testing Framework). The gauge chart represents the proportion of products with tests relative to the total number of products.
- Total Products with Insufficient Tests - Number of products with insufficient test coverage required for approval (see Manage Mandatory Test Cases for Product Approval). The gauge chart represents the proportion of products with insufficient tests relative to the total number of products.
- Total Products with No Tests - Number of products with no tests defined (see Product Testing Framework). The gauge chart represents the proportion of products without tests relative to the total number of products.
- Total AI Products - Number of products created based on templates suggested by Dex (see Use Dex to Create a Product Based on a Template). The gauge chart represents the proportion of AI-enhanced products relative to the total number of products.
- Total Bundle Offers - Number of offers that include Product Bundles. The gauge chart represents the proportion of bundle offers relative to the total number of offers.
- Products by Type - A doughnut chart representing the distribution of products by type. Clicking a segment opens the product list filtered by the selected product type (see Filter the Product List).
- Products by Status - A doughnut chart representing the distribution of products by status. Clicking a segment opens the product list filtered by the selected product status (see Filter the Product List).
- Latest Modified Products - A list of the three most recently updated products. Clicking a product opens it.
- Latest Modified Offers - A list of the three most recently updated offers. Clicking an offer opens it.
- Offers by Status - A doughnut chart representing the distribution of offers by status. Clicking a segment opens the offers list filtered by the selected offer status (see Filter the Offer List).
- Dormant Products - List of products that have remained in the Draft state for a defined period (see Product Life Cycle and Replication). You can filter the list based on the following time intervals: less than one month, one to three months, three to six months, and over 6 months. Clicking a product opens it.
- Dormant Offers - List of offers that have remained in the Draft state for a defined period (see Offer Life Cycle). You can filter the list based on the following time intervals: less than one month, one to three months, three to six months, or over 6 months. Clicking an offer opens it.
- Expiring Offers - List of offers that have expired or are about to expire. You can filter the list by the following expiration times: expired, less than seven days, seven to fourteen days, or fourteen to thirty days. Clicking an offer opens it.