Product Factory
The Product Factory menu item is available only for FintechOS Platform version 22.1.4 or later.
Product Factory allows you to manage your banking and insurance products. By default, only the Product Analytics submenu item is visible.
In order to access the banking or insurance product factory sub-menu items, install the banking and insurance product factory packages.
Product Analytics
In the Analytics section, click the Product Analytics submenu in order to open the product analytics page.
Here you can find key performance indicators that help with monitoring the banking or insurance products sales performance. The page displays all products that have a Product events published on their workflow.
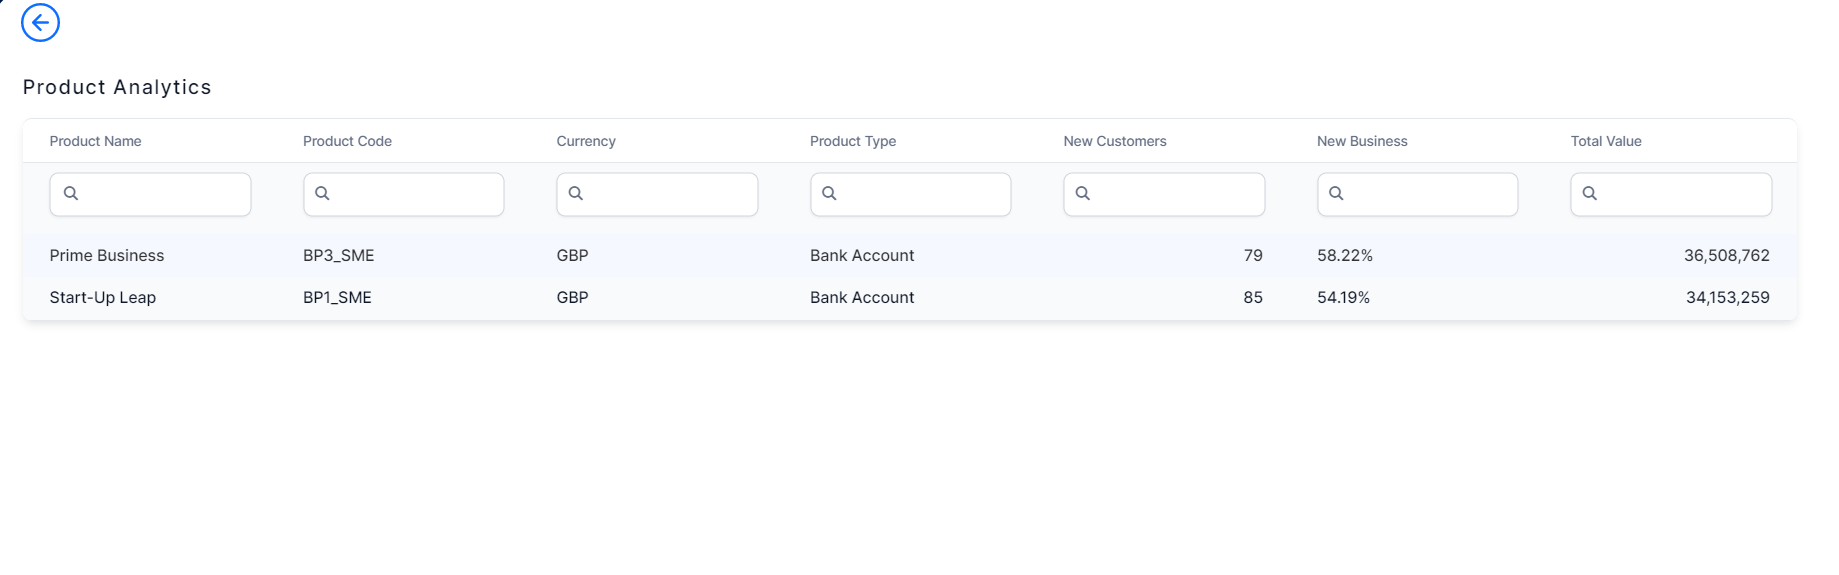
| Field | Description |
|---|---|
| Product Name |
The name of the product. |
| Product Code |
The code of the product. |
| Currency |
The currency for the total value. |
| Product Type |
The type of product. |
| New Customers | The number of signed contracts/issued policies by new customers. |
| Total Value |
The total value of the signed contracts/issued policies. |
| New Customers | The number of signed contracts/issued policies by new customers. |
| New Business | The percentage of the value of signed contracts/issued policies by new customers out of the total contracts/issued policies value. For instance, if there are two contracts signed, with a total value of $5,000, and only one of the contracts is signed by a new customer, but the value of this contract is $4,500, the new business is 90%. |
The KPI values are the total values calculated based on the product event date: if the product event is published at the current date, the product analytics list shows today's data only. For existing journeys, Add historic data to Product Analytics to list the KPIs' total values starting from the past up until the current date.
Product Analytics Details
Double click a product to open a dashboard for a more detailed overview of the product's performance. The product dashboard includes the following KPIs:
| KPI | Description |
|---|---|
| Application In Progress | The number of product journeys that are in progress at the current date. |
| Conversion Rate | The percentage of signed contracts/issued policies from the total number of journeys initiated. |
| Rejection Rate | The percentage of rejected applications out of the total number of applications. |
| Contracts Signed | The number of signed contracts/issued policies. |
| Time to Yes | The average time between the journey start date and contract sign. |
| Total Value |
The total value of the signed contracts/issued policies. Unlike in the product analytics list, here the KPI value is for the current month/day. |
| New Customers | The number of signed contracts/issued policies by new customers.Unlike in the product analytics list, here the KPI value is calculated for the current month/current day . |
| New Business | The percentage of the value of signed contracts/issued policies by new customers out of the total contracts/issued policies value. Unlike in the product analytics list, here the KPI value is calculated for the current month/day. |
For the monthly view, the KPIs are calculated for the current month.
The percentage reflects the difference between the KPI value calculated for the number of days that have passed in the current month and the value of the KPI calculated for the same number of days in the previous month.
For instance, if the current date is 14th March 2022, the percentage represents the comparison of the KPI values for 1-14 March 2022 and 1-14 February 2022.
The graphs on the page display the calculated KPI values for the last 12 months.
For the daily view, the KPIs are calculated for the current day.
The percentage reflects the difference between the KPI value calculated for the current day and the value of the KPI calculated for the previous day.
The graphs on the page display the calculated KPI values for the last 30 days.
Product events
Product KPIs are calculated based on events that need to be raised on each banking/insurance product you want displayed in the Product Analytics page.
| Event Name | Event Description | Impacted KPI | Raise event |
|---|---|---|---|
| JourneyStart |
Journey event that occurs when a banking/insurance journey begins. |
Application In Progress and Conversion Rate. |
When the first business status change occurs. |
| JourneyAbandoned |
Journey event that occurs when a banking/insurance journey expires. |
Application In Progress. | When the journey business status changes after a period of inactivity. |
| JourneyUnsuccess |
Journey event that occurs when a banking/insurance journey is finished but no contract/policy is signed. |
Application In Progress. | On the journey step or the business status change that indicates the customer has refused the contract/policy offer. |
| JourneySuccess |
Journey event that occurs when a banking/insurance journey is finished and the contract/policy is signed. |
New Customers, New Business, Time to Yes, Total Value, Conversion Rate, Contract Signed, and Application In Progress. | On the journey step or the business status change that indicates the contract/policy is signed or generated. |
| ProductApproved |
Journey event that must be raised after an offer is submitted and after the customer application/ quote is approved. |
Rejection Rate. | After the business status change that indicates the product is approved. |
| ProductRejected |
Journey event that must be raised after the customer application/quote is rejected. |
Rejection Rate. | After the business status change that indicates the product is rejected. |
Raise events
Use the server.event.publish server SDK method to trigger the product events when a journey changes one business status to another, or on a journey step. In case your product is offered on more than one journey (for instance on both an assisted and a self-assisted journey), make sure the events are triggered on each journey.
-
In the business workflow transition configuration, add or edit the action groups for the workflow.
-
In the Action After tab, insert a workflow transition action of the Run Custom Script type.
-
Use the Code section to raise the event using the server.event.publish method.
-
Create an on-demand server automation script for server.event.publish method.
-
Call the script in the AfterJs section of the journey step using ebs.callActionByName.
GIGO applies to the product analytics KPIs, as their accuracy depends on the rigor with which events data is populated. Therefore when configuring analytics, make sure sure there are no missing, fictitious, inaccurate or duplicate events.
Add historic data to Product Analytics
For banking/insurance products that are currently running in production, there is the option to bring in historic data for the calculation of the product KPIs.
Prerequisite
Add the Product Analytics Utility security role to your profile.
1 Populate events Excel template
The product utility import template Excel file can be found by unpacking the SysDigitalSolutionPackages.
-
Fill in the .xlsx template columns with the data you want to import in Product Analytics.
In order to ensure a successful import, make sure the columns are completed based on each event type, add the event date in YYYY-MM-DD format and all numeric values, apart for the contract value, as whole numbers. Do not alter the column order.
2 Upload historic data
-
In the Product Factory menu item, scroll down to Product Configuration. Double click Analytics Utility.
The analytics utility list opens.
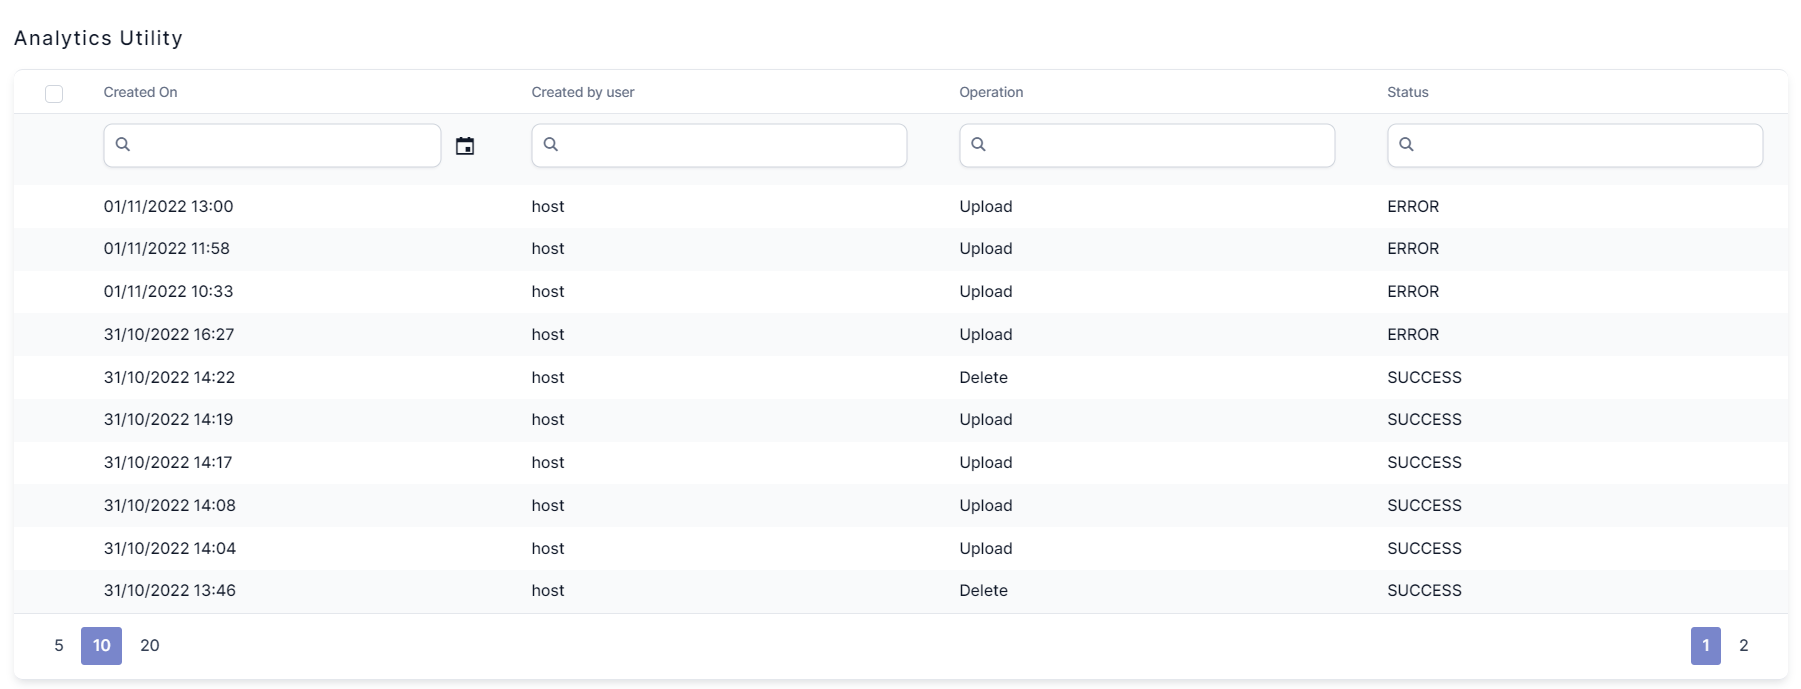
Field Description Created on The date when the operation is created.
Created by user The user that inserted the operation.
Operation The performed action. Can be either Upload or Delete.
Status The status of the operation. Can be either Success or Error.
-
Select Upload from the dropdown.
-
Add the filled-in Excel file.
-
Click Start import.
The analytics utility page now displays your operation with an updated status: success or error.
-
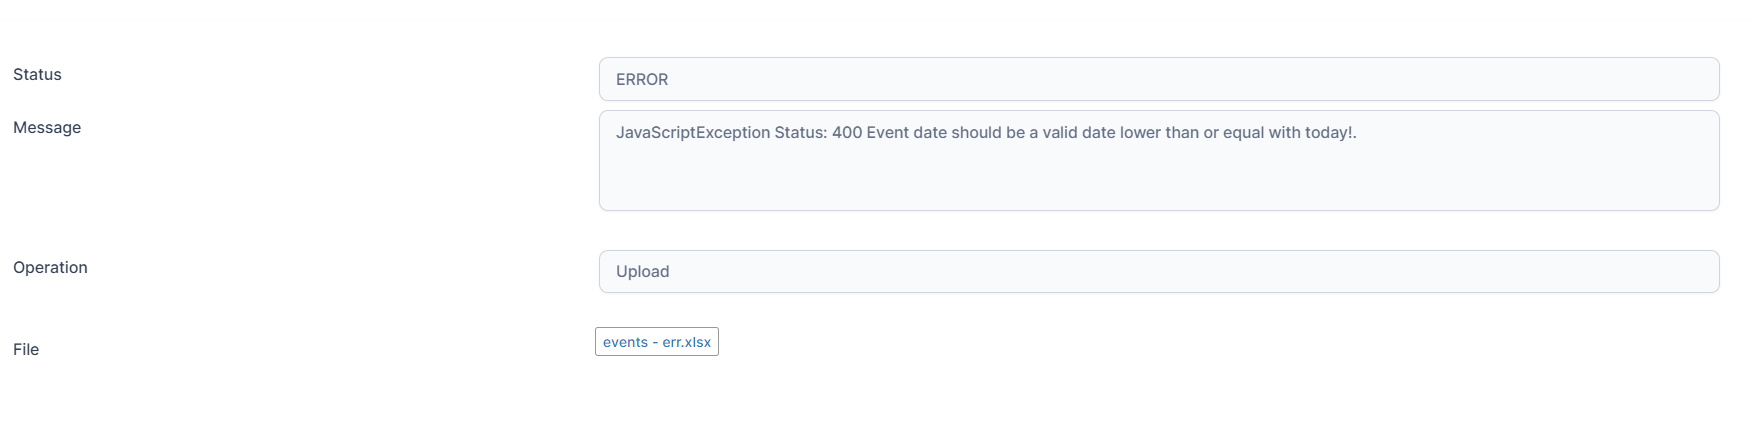
Double click the operation to see more details on the import. In case the import has a success status, check the message field to see how many events were imported successfully.
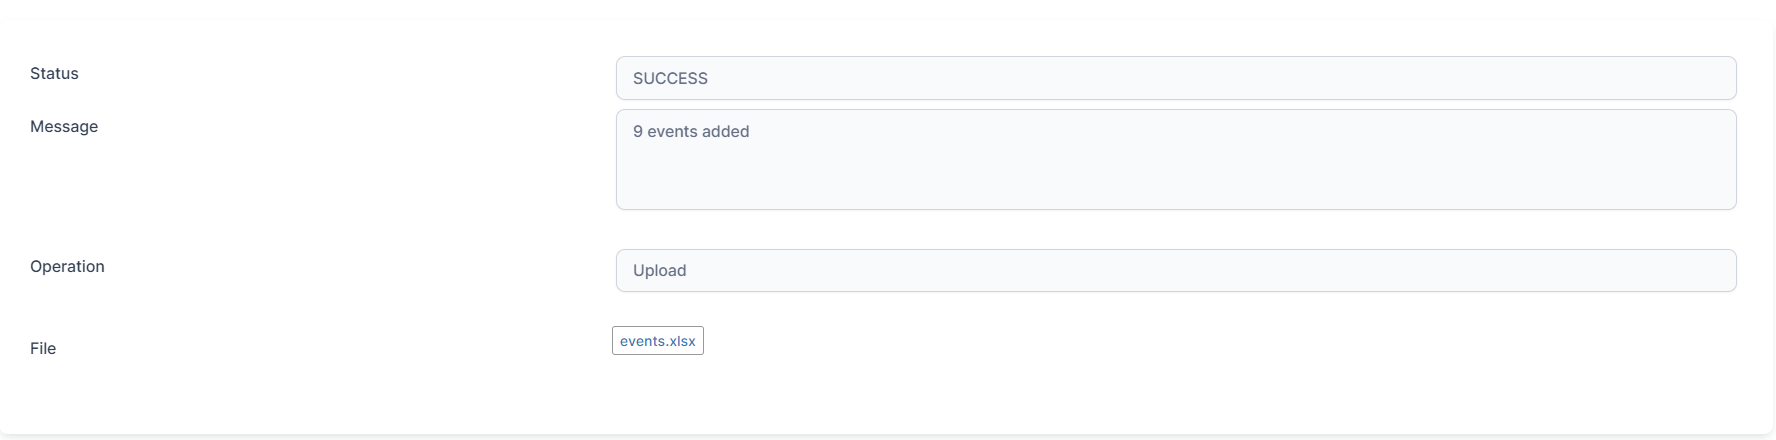
If the status is error, the toast error message is listed in the message field.
After upload, the product analytics metrics are calculated taking into account the product data from the past up until the current date.
Delete imported data
-
On the Analytics Utility page, click Insert to add a new operation.
-
Select Delete from the dropdown. A list with all the products in product analytics appears.
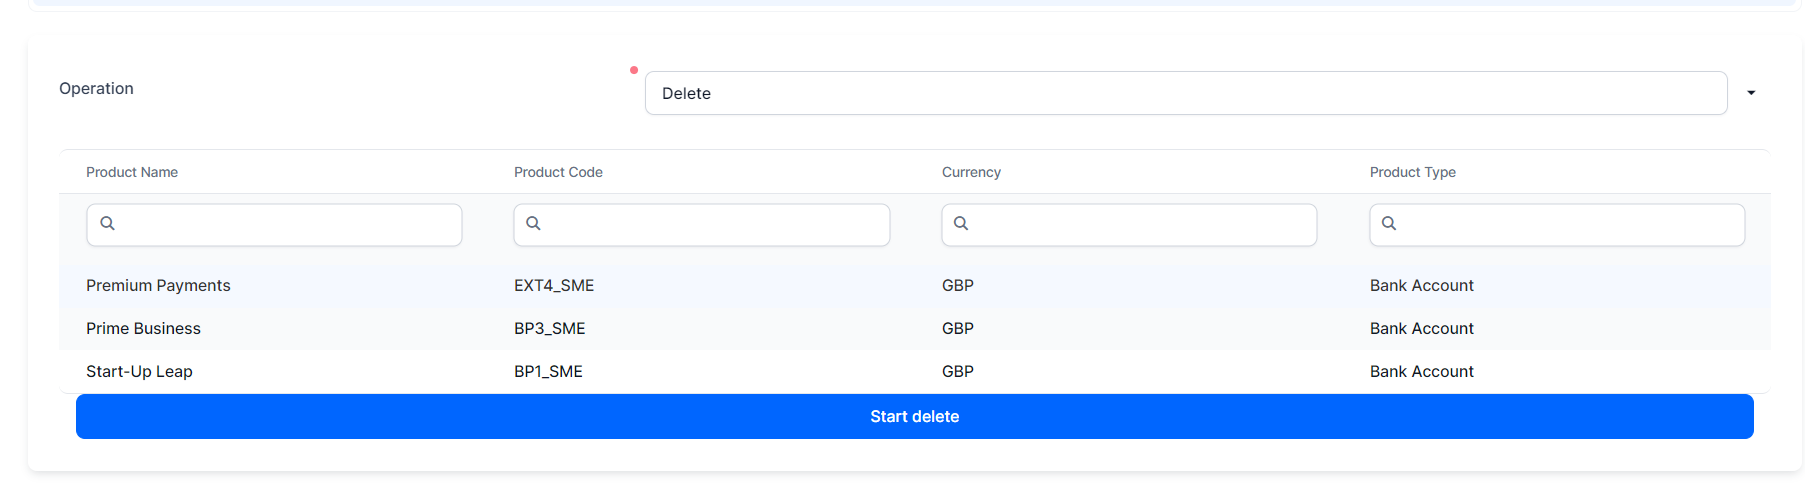
-
Select the product for which you want to delete data.
-
Click Start Delete.
If the operation is successful, the product performance historic data is erased from the product analytics page.