
Adding Charts to Dashboards
This section walks you through the steps for adding charts to dashboards, as well as for resizing and customizing charts.
Prerequisite
If you want to add charts to dashboards, you first need to create the chart.
Add widgets to dashboards
To add a chart to a dashboard, follow these steps:
- From the menu, click Digital Frontends > Digital Experience Portals > Dashboards. The Dashboards List page opens.
- Double-click the desired dashboard from the list. The dashboard configuration page appears.
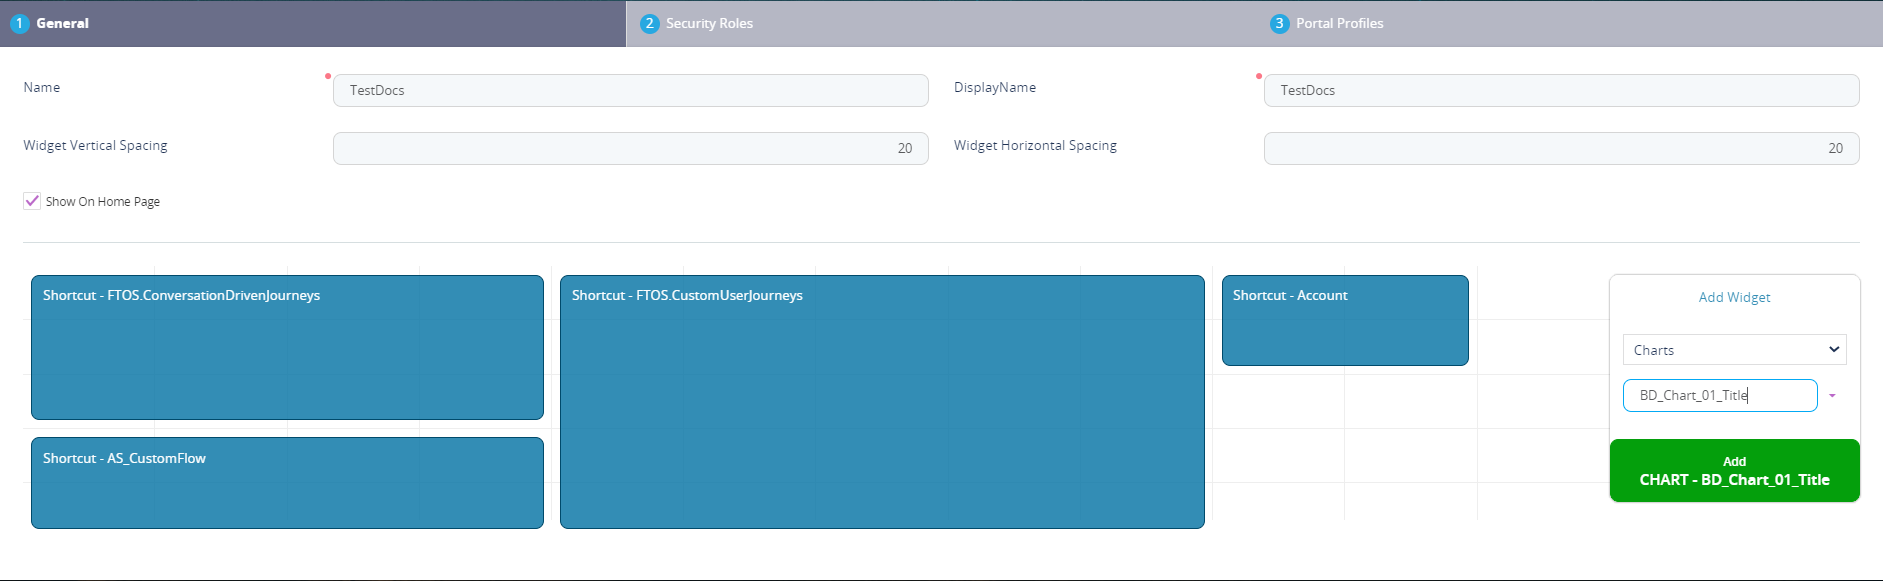
- In the Add Widget area, from the widget type drop-down list, select Charts. For more details, see Charts.
- Select the chart to be added.
- Click the Add button. The selected chart is displayed on the left side of the page.
- Optionally, customize the widget. For more information on how to customize widgets, see section below.
- At the top-right corner of the page, click the Save and close icon.
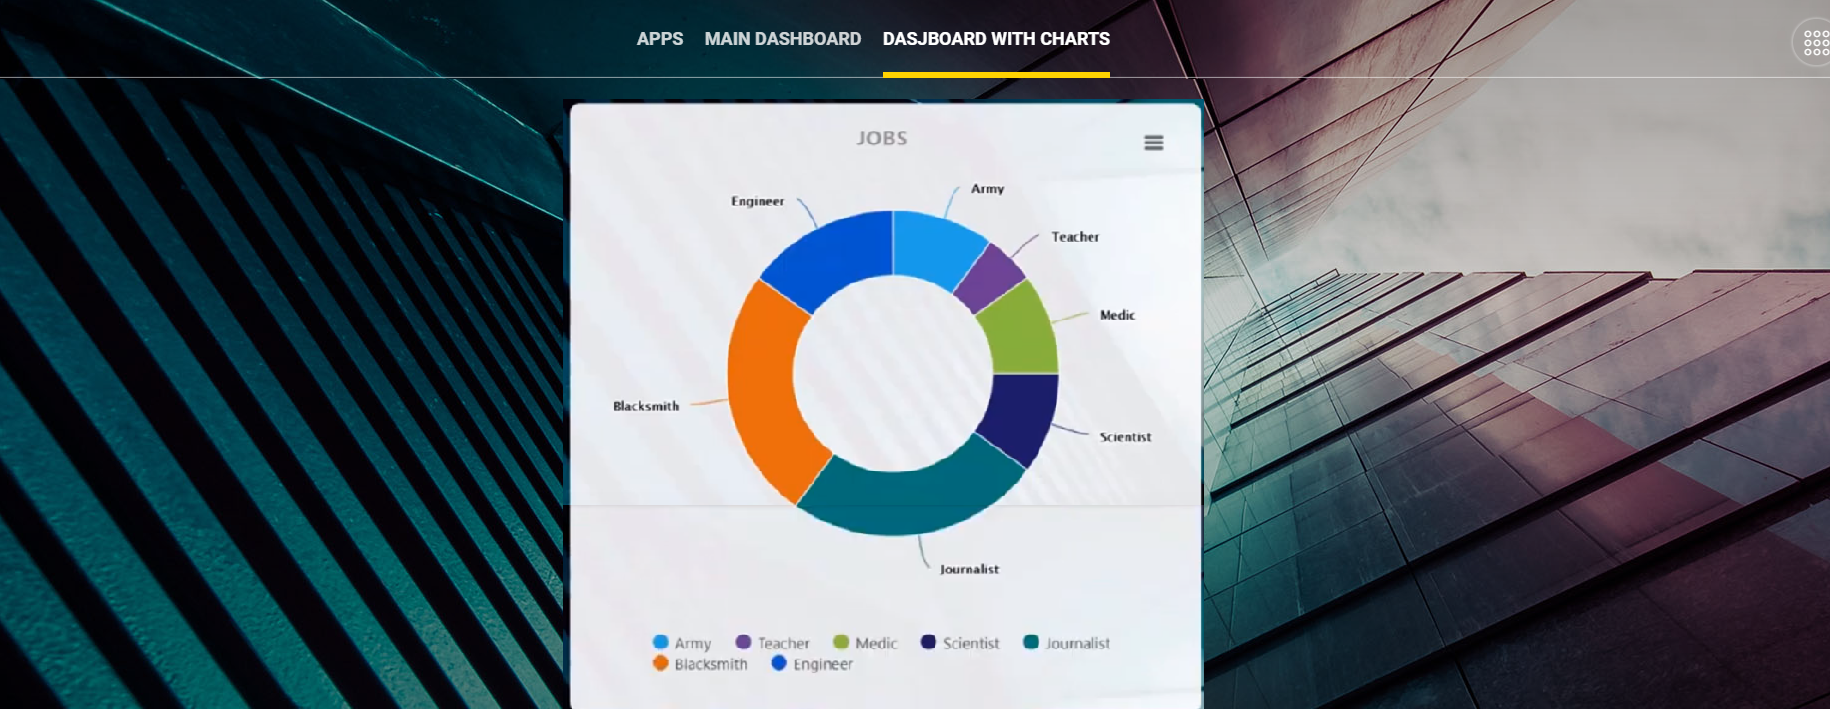
The figure below shows how a chart may look like on a dashboard in the Digital Experience Portal.
Customize Widgets
There are various options for customizing the way widgets of type charts are displayed in the Digital Experience Portals: resizing. One of them is by adding widget details and customizing the widget layout.
Resize Widgets
You can resize dashboard widgets by placing the cursor on the bottom-right corner of the widget that you want to resize. Click and simultaneously drag and drop to rezise as preferred.
Customize Widgets Layout
To customize the layout of a widget double click the chart widget, click the Customize Widget tab on the right side and make the desired layout settings.
Click the Add Widget tab. You can choose to add a title by clicking the Show Title checkbox and providing the widget title to be displayed on the widget.
Click the Save Widget button and at the top-right corner of the page, click the Save and close icon to save the changes.