Dashboards
Omnichannel Campaigns offers the possibility of viewing centralized campaign activities at execution and manager level. This feature aids campaign managers assign campaign tasks in a practical manner and keep track of updates. In addition, execution users can view their assigned activities.
To access the dashboard, log into the FintechOS Portal with the given credentials and select the Internal Campaigns tab. In this page, the following tabs are displayed:
The activities displayed are based on the user role. For example, a manager can view the activities related to their team, while a user with an execution role views their activities or their branch's unassigned activities.
In this tab, all relevant information related to an internal sales activity is displayed. This allows users to contact retail or corporate clients in order to promote company products or services. Here, the following tasks can be viewed:
-
My sales activities/ My team's sales activities:
-
The open sales activities option displays the active sales campaign activities list that have the following statuses: Assigned or In progress.
-
The closed sales activities option displays the sales campaign activities list that have the following statuses: Completed, Converted, Won, Lost, or Unsuccessful.
-
-
My branch unassigned activities/ My team's unassigned activities displays the activities that are not allocated to a user. Here, users can assign tasks based on their user role using the Assign to me (execution view) or Assign to user (manager view) buttons.
In this tab, all the relevant information related to an internal administrative activity is displayed in order to help the person in charge of the campaign understand and finalize the campaign activity. Here, the following tasks can be viewed:
My administrative activities/ My team's administrative activities:
The open administrative activities option displays the active administrative campaign activities list that have the following statuses: Assigned or In progress.
The closed administrative activities option displays the administrative campaign activities list that have the following statuses: Completed or Unsuccessful.
My branch unassigned activities/ My team's unassigned administrative activities displays the activities that are not allocated to a user. Here, users can assign tasks based on their user role using the Assign to me (execution view) or Assign to user (manager view) buttons.
For analysis and reporting purposes select the desired records from the campaign list and click the Export button to download the data set. If the grid is filtered or truncated (displaying 5, 10, 20, etc. entries per page out of a larger set), the current set export includes only the displayed values.
On both tabs the following data is displayed:
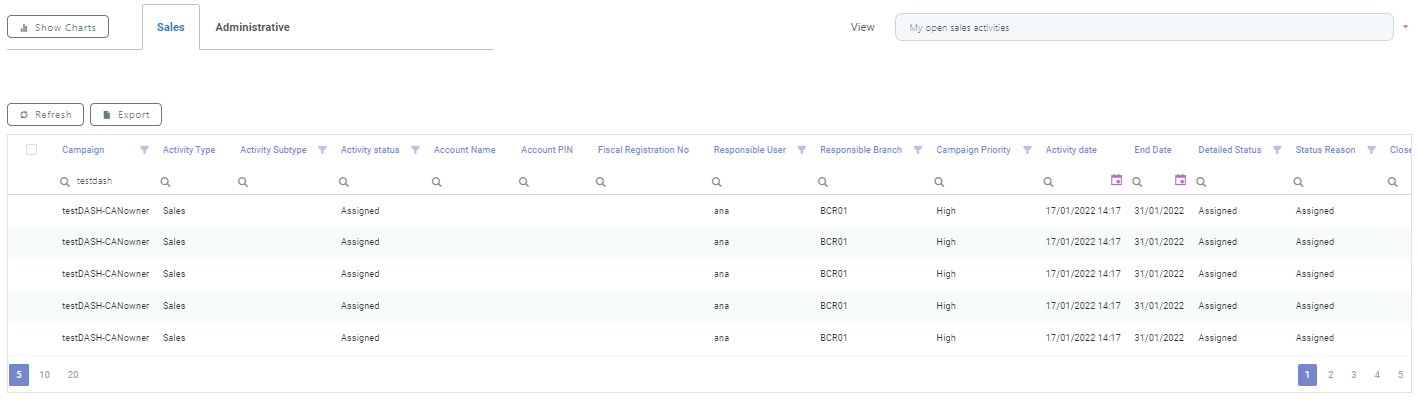
| Field | Description |
|---|---|
| Campaign | The campaign number. |
| Activity Type | The activity type: sales or administrative. |
| Activity Subtype | The activity subtype. |
| Activity status | The activity status. |
| Account Name | The name of the account. |
| Account PIN | The account PIN. |
| Fiscal Registration No | The fiscal registration number of a corporate account. |
| Responsible User | The person responsible of the campaign activity. |
| Responsible Branch | The bank branch responsible of the campaign activity. |
| Campaign Priority | The campaign priority. |
| Activity date | The date the campaign activity begins. |
| End Date | The date the campaign activity ends. |
| Detailed Status | A detailed status of the campaign activity. |
| Status Reason | The status reason. |
| Closed On | The date the campaign was closed on. |
| Completed | If True, it indicates the campaign activity is completed. |
The data from the activities grid can be filtered for a faster record search.
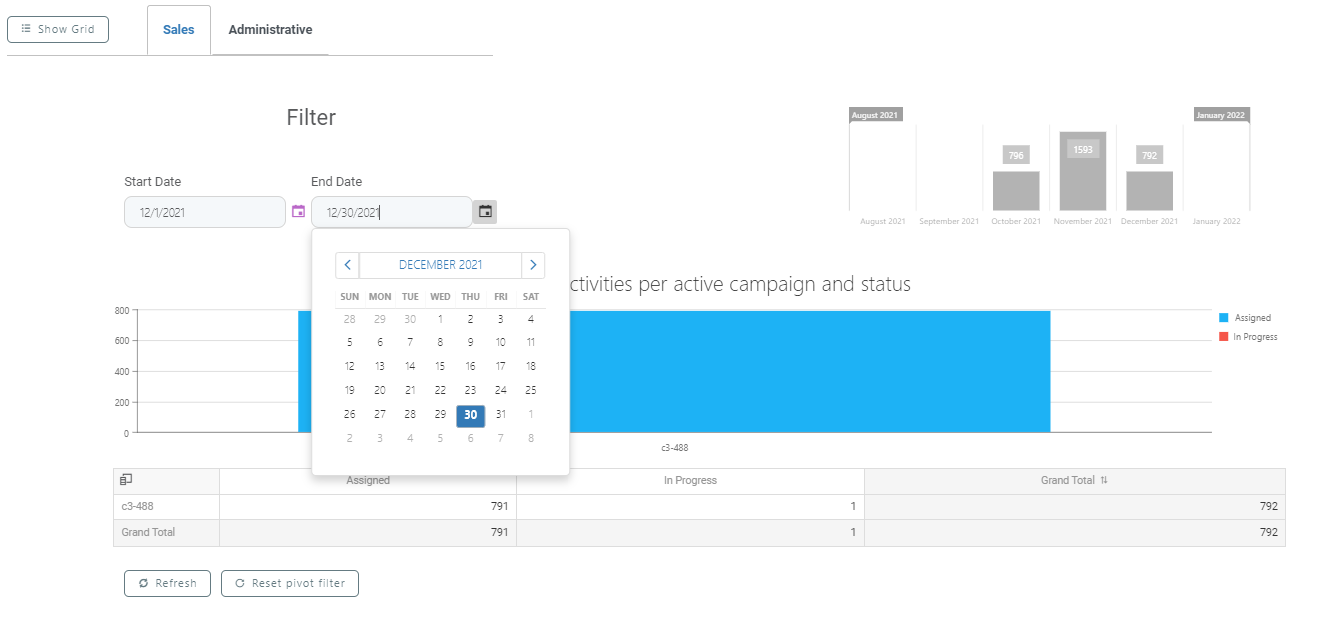
Viewing Activities Dashboard Charts
Dashboard charts are useful tools that can be used to identify which activities are assigned to a certain bank branch or employee to easily see the status of each task.
To view the charts, select either the Sales or Administrative tab and then click the Show Charts button from the upper left corner. The displayed is filtered by default for the last three months.

To filter the display period , change the Start Date and the End Date.
Filtering Dashboard Data
To change the way the information from the pivot table is viewed, select the Show Field Chooser option. A pivot filter is displayed with the following default settings:
-
The row fields display the Campaign, Branch, and User fields.
NOTE
The default settings are different depending on the user's role. In case of a user with execution role, the Branch and User fields are not displayed. -
The column fields display the Status field.
-
The data fields display the Total field.
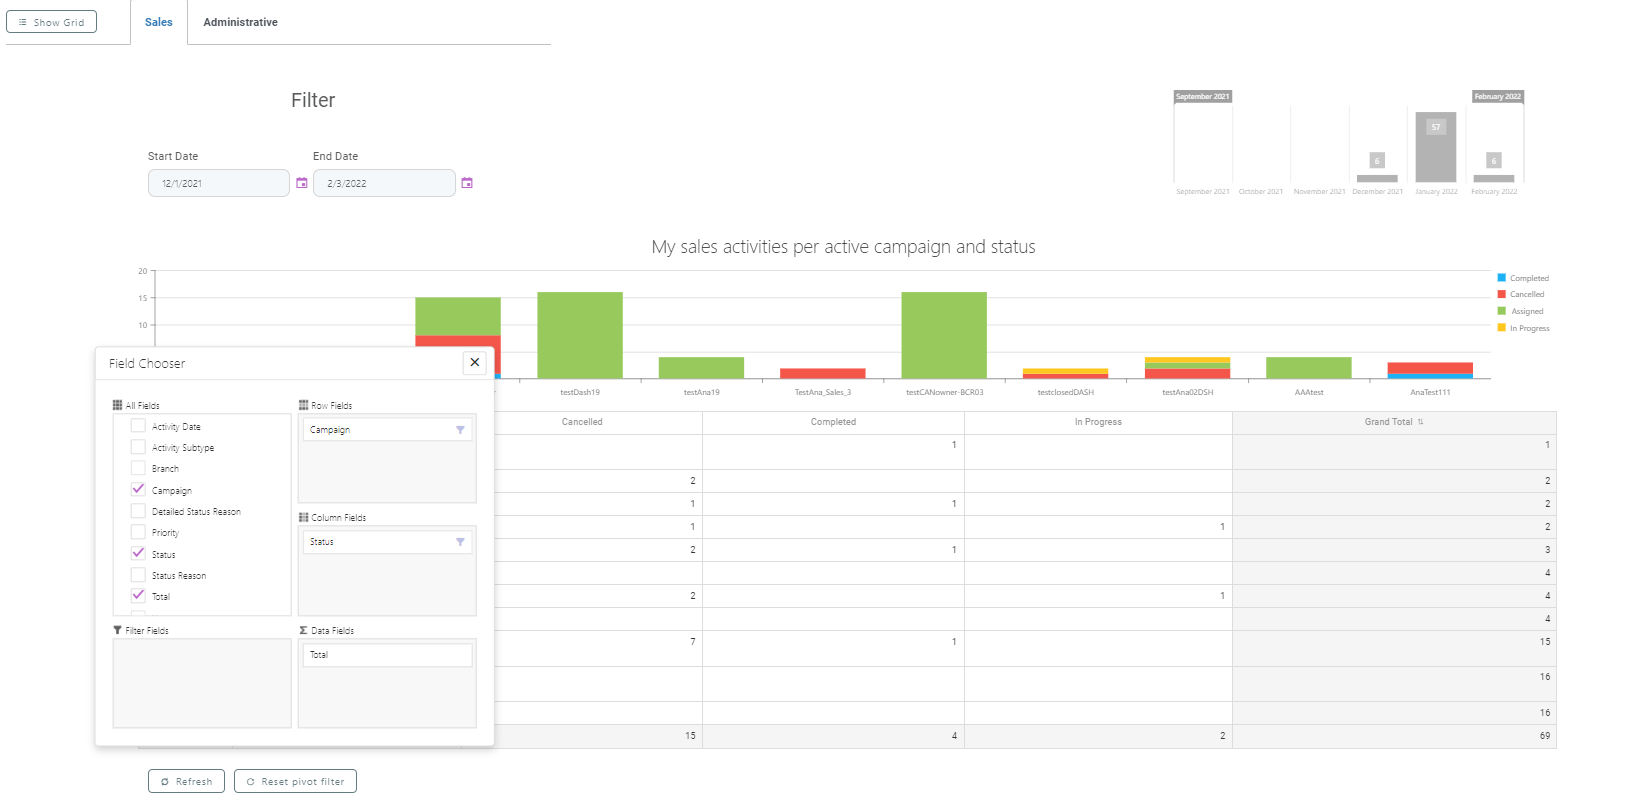
The pivot option is customizable depending on the data needed. To return to the default settings, click the Reset pivot filter button.
The Campaign/ Branch/ User, Status, and Total fields are displayed based on the rules set in the pivot table option. For example, each manager sees only the activities assigned to direct or indirect subordinates and the activities assigned to their branch or to the branch that is a direct or indirect child of their branch. The same rules apply to the person the campaign activity is assigned to. They are able to view only the activities assigned to them.
The pivot settings are saved for each particular user and are not reset after logging off.
To return to the grid view, click the Show Grid button from the upper left corner.