Built-in Analytics
The digital journey analytics are a set of built-in indicators that offer insight on the performance and statistics of your digital journey. The data indicators calculate the success ratio of your digital journey, the number of Not Completed vs. Completed digital journeys, completion time, abandonment rate, average time spent on a specific step, etc.
In order to view the analytics charts, the user must have the DjAnalytics or Developer security role assigned to them in the platform. For more information, see Security. All entities from the journey must have business transitions workflows defined. For more info, see Business Workflows.
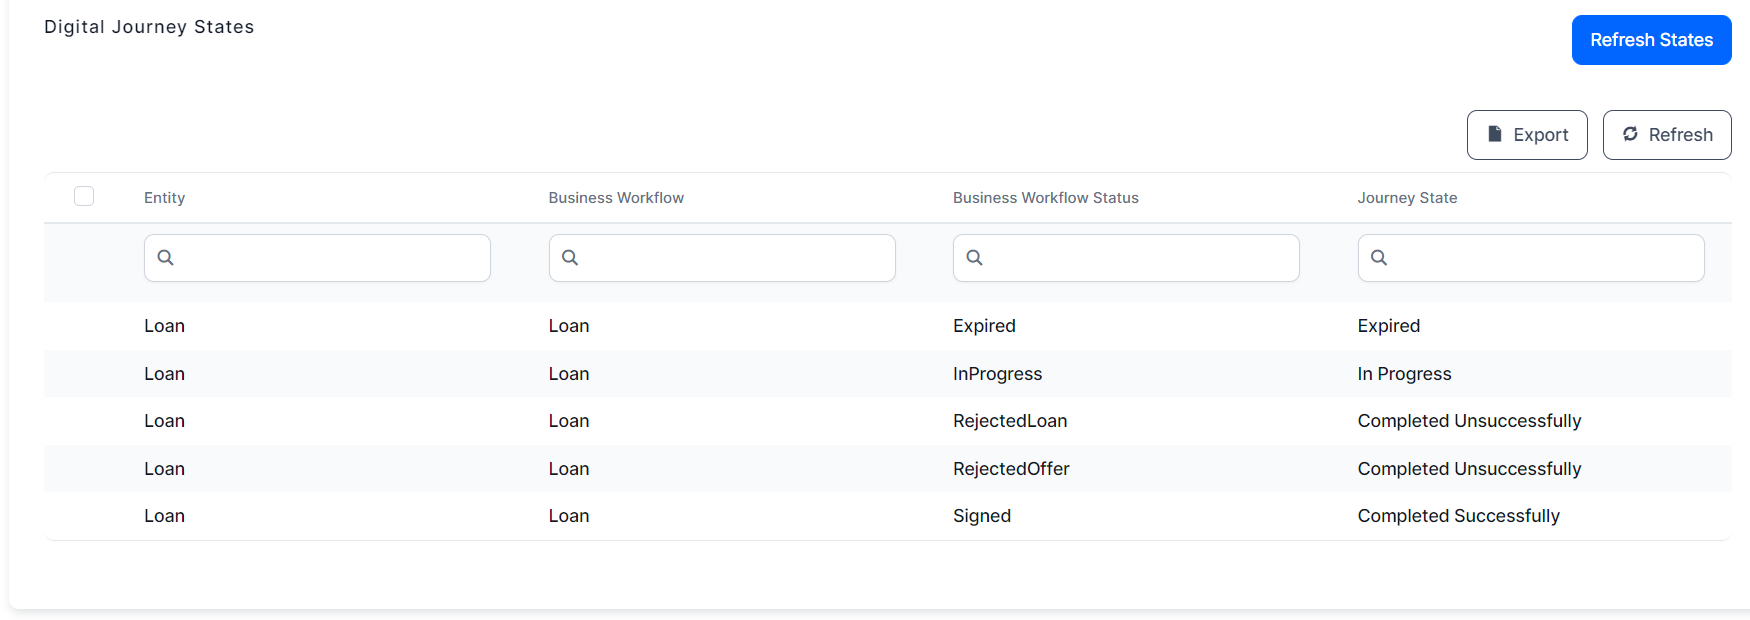
In the General tab of your digital journey, under Digital Journey Flows, there is the Digital Journey States grid. This displays all distinct entities that have Business States and are part of the form driven flows included in the digital journey. The existing Business States are correlated to the predefined Journey States that encompass key phases of a user journey:
- N/A (default)
- In progress – journeys started but not yet completed.
- Expired/Abandoned – journeys where the user quit the process or did not take any action within a certain amount of time.
- Completed successfully – journeys that resulted in a contracted loan, or a loan disbursement.
- Completed unsuccessfully - journeys that didn’t result in a completed loan application, even though the user went through all the steps of the journey.
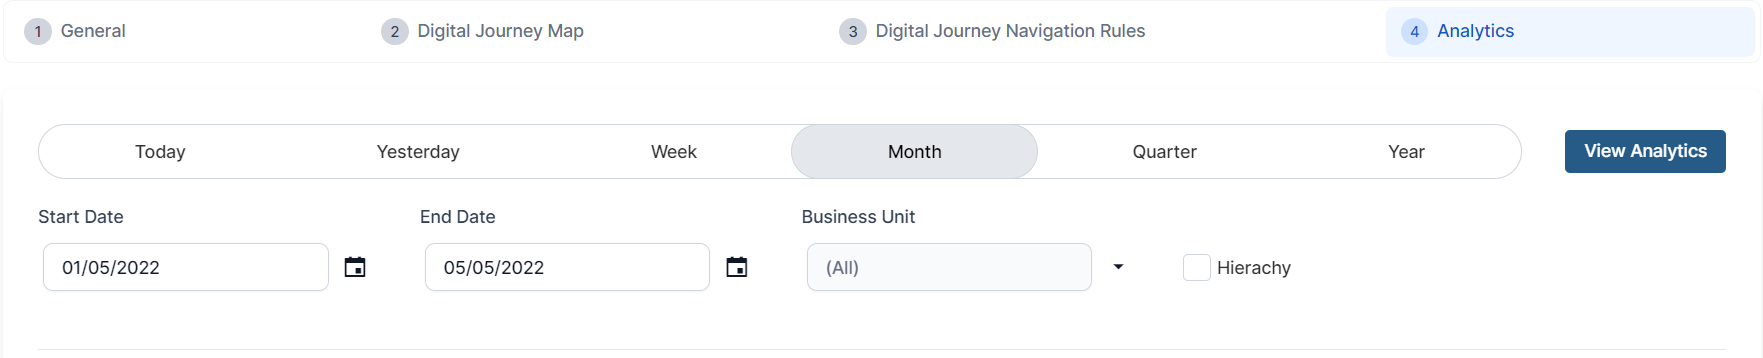
A more in-depth representation is available as charts, in the Analytics tab. Here, you can filter the results by day, week, month, year, or customize your selection to show analytics from a specific time frame.
The charts can be downloaded individually in PNG, JPEG, PDF, and SVG format. The following statistics are included in the performance indicators charts:
-
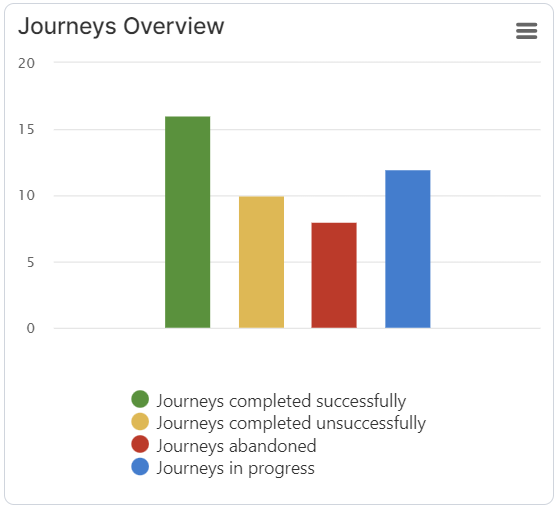
Journeys Overview – shows the total number of the digital journeys and their state and outcome: in progress, abandoned, successfully completed, and unsuccessfully completed.
-
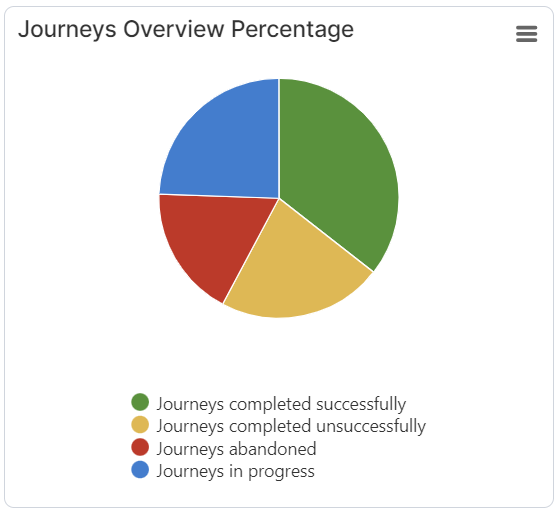
Journeys Overview Percentage – shows the percentages of the different states of digital journey instances: in progress, abandoned, completed successfully, and completed unsuccessfully.
-
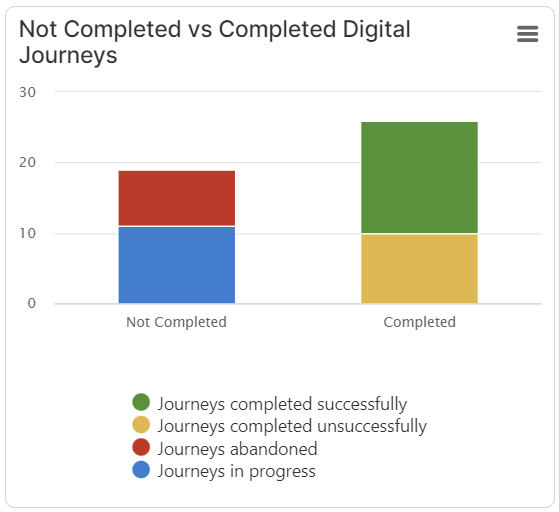
Not Completed vs Completed Digital Journeys – shows the number of not completed (in progress / abandoned) and completed (successfully / unsuccessfully) digital journeys.
-
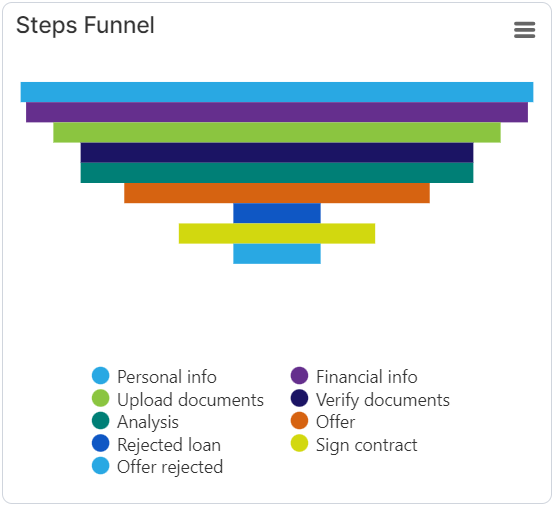
Steps Funnel – shows all the steps of the journey and the number of remaining users when transferring to subsequent steps, as they begin the journey and navigate from one step to another. Each step shows the number of users who have gone through it, counting in progress, completed successfully, unsuccessfully, and abandoned digital journeys.
-
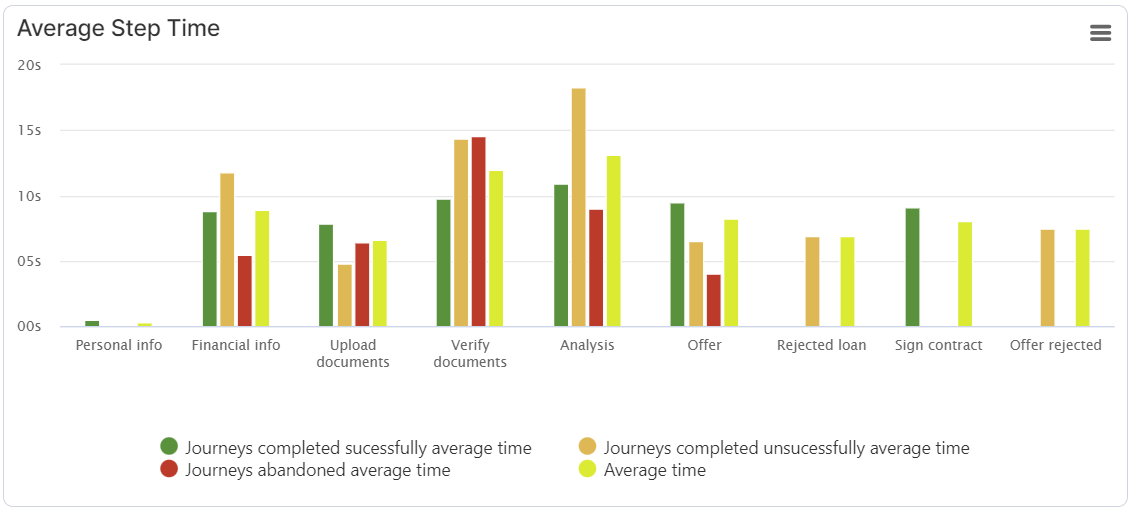
Average Step Time – shows the average amount of time spent per step and whether the specific step is associated with a successful/unsuccessful/abandoned digital journey.
-
Step In/Out – similar to the Funnel chart, this shows the number of users who went through a step of the digital journey (Step In) and the number of users who moved to a different step from there (Step Out), counting the number of entries per instance. When the user goes through the same step, if the flow control/navigation rules require them to do so, it is considered an entry. It applies to in progress, completed successfully, unsuccessfully, and abandoned digital journeys.
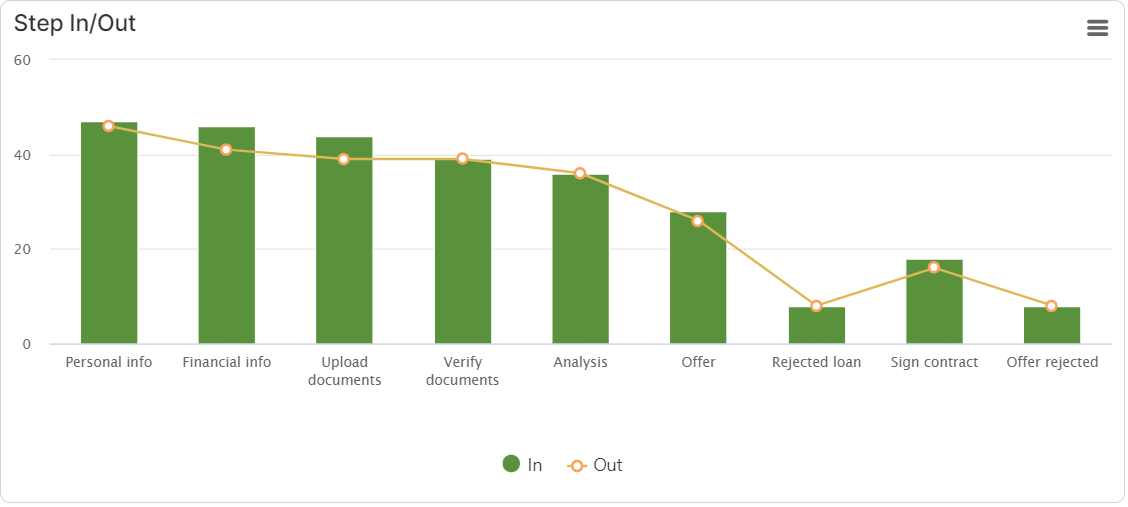
-
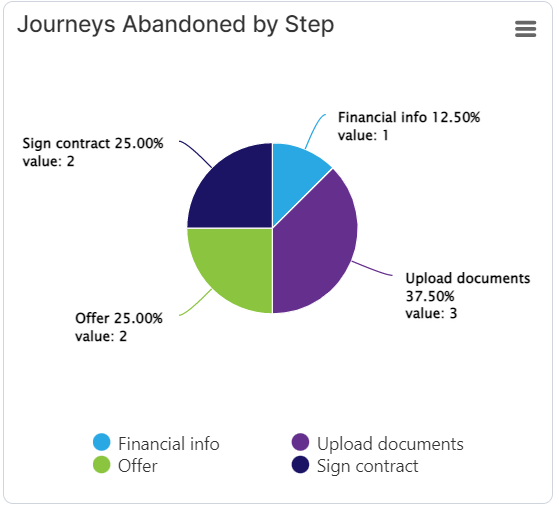
Journeys Abandoned by Step – shows the specific steps (in percentages) where the digital journey instances have been abandoned.
 IMPORTANT! The charts for Steps Funnel, Average Step Time, Step In/Out, and Journey Abandoned by Step show the steps in alphabetical order, by their display names. To see the actual order of the steps, as consumed by the user, you should number the steps when configuring the flow(s) for the digital journey.
 -
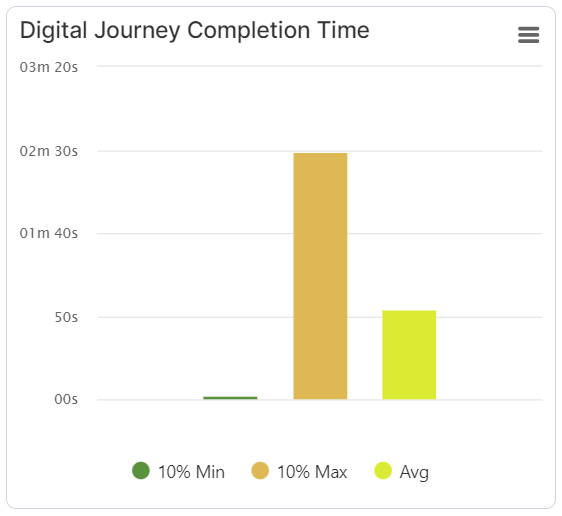
Digital Journey Completion Time – displays the average of the 10% digital journeys that took the least/longest amount of time to complete (in minutes). This could help determine proportionally whether your digital journey is easy to go through or not. The “Avg” metric displays an average between all digital journey instances. This chart counts the digital journeys that are completed successfully, unsuccessfully, or abandoned.
-
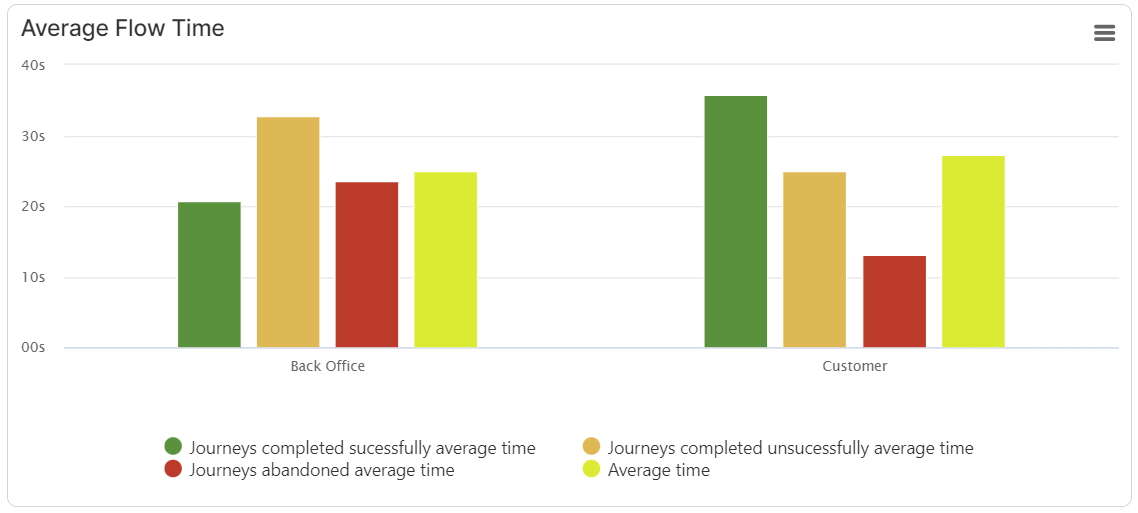
Average Flow Time – shows the average amount of time spent (in minutes) on specific form driven flows that are part of the digital journey.