Insurance Dashboard
When you install the Insurance Servicing package, the Insurance Dashboard is now enabled automatically. You no longer need to manually configure or activate it after installation. This means you can start using the dashboard right away, without any additional setup steps. If you are setting up a new environment, the dashboard will be ready as soon as the installation completes.
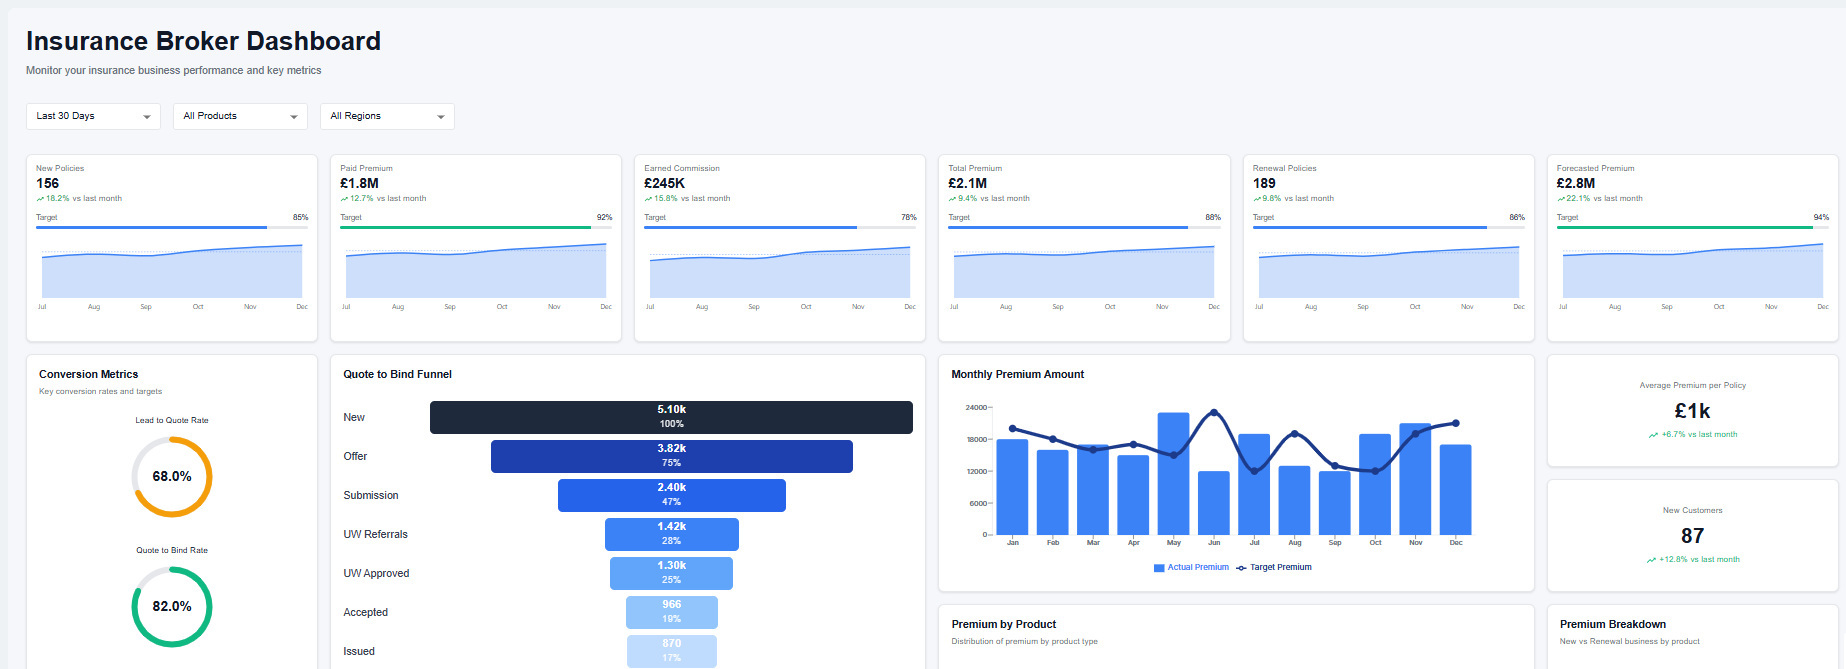
KPI Cards
The top row gives you a quick snapshot of your most important business metrics at a glance. Each card shows the current value, a percentage change compared to last month, and a progress bar toward your target.
-
New Policies — Shows how many new policies were created in the selected period. You can see whether you are ahead or behind compared to last month and how close you are to your target.
-
Paid Premium — Displays the total premium amount collected. The trend line helps you spot whether collections are growing or declining over time.
-
Earned Commission — Shows the commission you have earned from active policies, with a month-over-month comparison so you can track performance.
-
Total Premium — Gives you the combined premium value across all policies, including both new and renewed business.
-
Renewal Policies — Tracks how many policies are being renewed. You can use this to monitor retention and identify whether renewal activity is on track.
-
Forecasted Premium — Shows the projected premium based on your current pipeline, helping you plan ahead and set realistic expectations.
Conversion Metrics
This panel helps you understand how effectively your pipeline is converting at each stage.
-
Lead to Quote Rate — Shows the percentage of leads that result in a quote. A higher rate means your team is engaging leads successfully.
-
Quote to Bind Rate — Tells you how many quotes are converting into bound policies. This is one of the most direct indicators of sales effectiveness.
-
Renewal Rate — Shows the percentage of policies that are successfully renewed, giving you a clear view of customer retention.
-
Churn Rate — Displays the percentage of policies that were not renewed or were cancelled, so you can identify where you are losing business.
Quote to Bind Funnel
This chart shows you how quotes move through each stage of the underwriting process, from initial submission all the way to issuance. You can see the volume at each stage — New, Offer, Submission, UW Referrals, UW Approved, Accepted, and Issued — and quickly identify where drop-offs are happening in your pipeline.
Premium Performance
-
Monthly Premium Amount — A bar chart that compares your actual premium collected each month against your target premium. The trend line helps you see whether you are consistently meeting targets or falling short.
-
Average Premium per Policy — Shows the average value of each policy, along with a month-over-month change. Alongside this, you also see the number of new customers acquired, so you can connect volume with value.
Premium Distribution
-
Premium by Product — A donut chart that breaks down your total premium by product type, such as Cyber, Health, Pet, Fire, and Travel. You can use this to understand which products are driving the most revenue.
-
Premium Breakdown — A stacked bar chart that splits premium into new and renewed business by product. This helps you see where growth is coming from and which products rely more heavily on renewals.
Underwriting and Cancellations
-
Underwriting Rejection Reasons — A bar and line chart that shows the most common reasons policies are rejected during underwriting. You can use this to identify patterns and work with your team to address recurring issues.
-
Cancellation Reasons — A horizontal bar chart listing the reasons policies were cancelled. This helps you understand why customers are leaving and where you may need to take action.
-
UW Approval Rate — Shows the percentage of policies that passed underwriting review, currently at 94%. Below this, you also see the number of cancelled policies and how that figure compares to last month.
Data Core Sync
You can automatically send record data to the Data Core. When a process is triggered, the system captures the specific record and its current stage, then processes it in the background to ensure the Data Core is updated.
To control this feature, you must update the BO_ActivateDataCoreSync system parameter:
- Set to 1: Enables the automatic sync. The system will process and send data for your records.
- Set to 0: Disables the sync. No data will be sent to the Data Core.